As you set up user tracking, MyTracker will provide all the data to analyze user experience in your project: reports on user events on different platforms, comparisons of new users and new devices, campaign results, and more.
MyTracker provides several tools for reports:
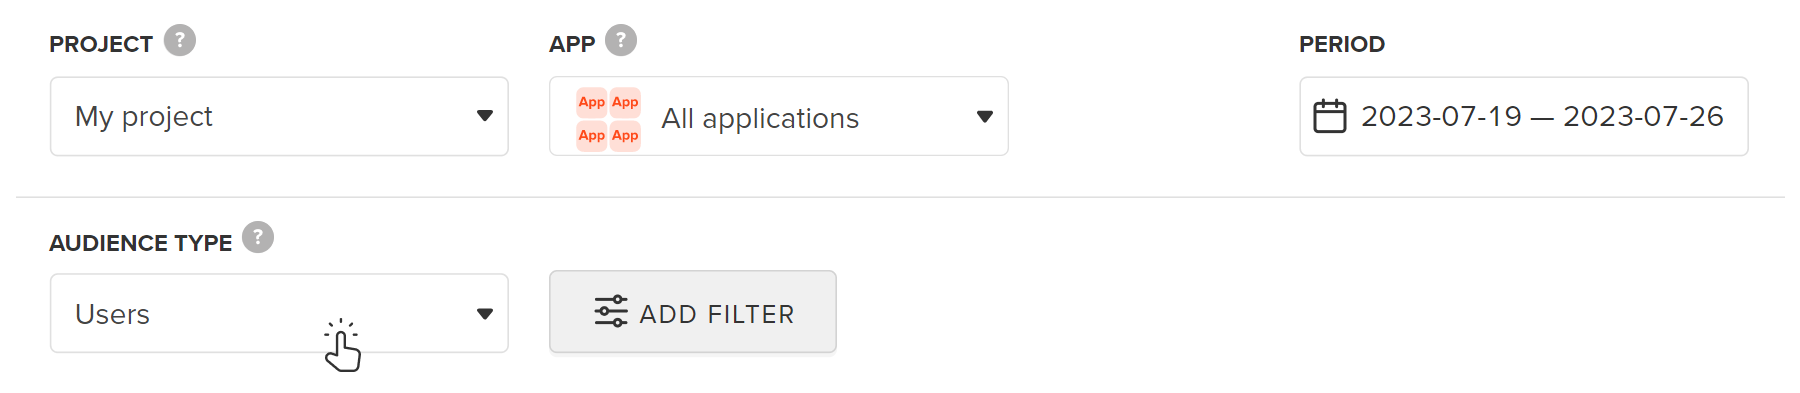
Reports present information in a simple diagrams and graphs. To view the stats by project users, select Users in the Audience type field.
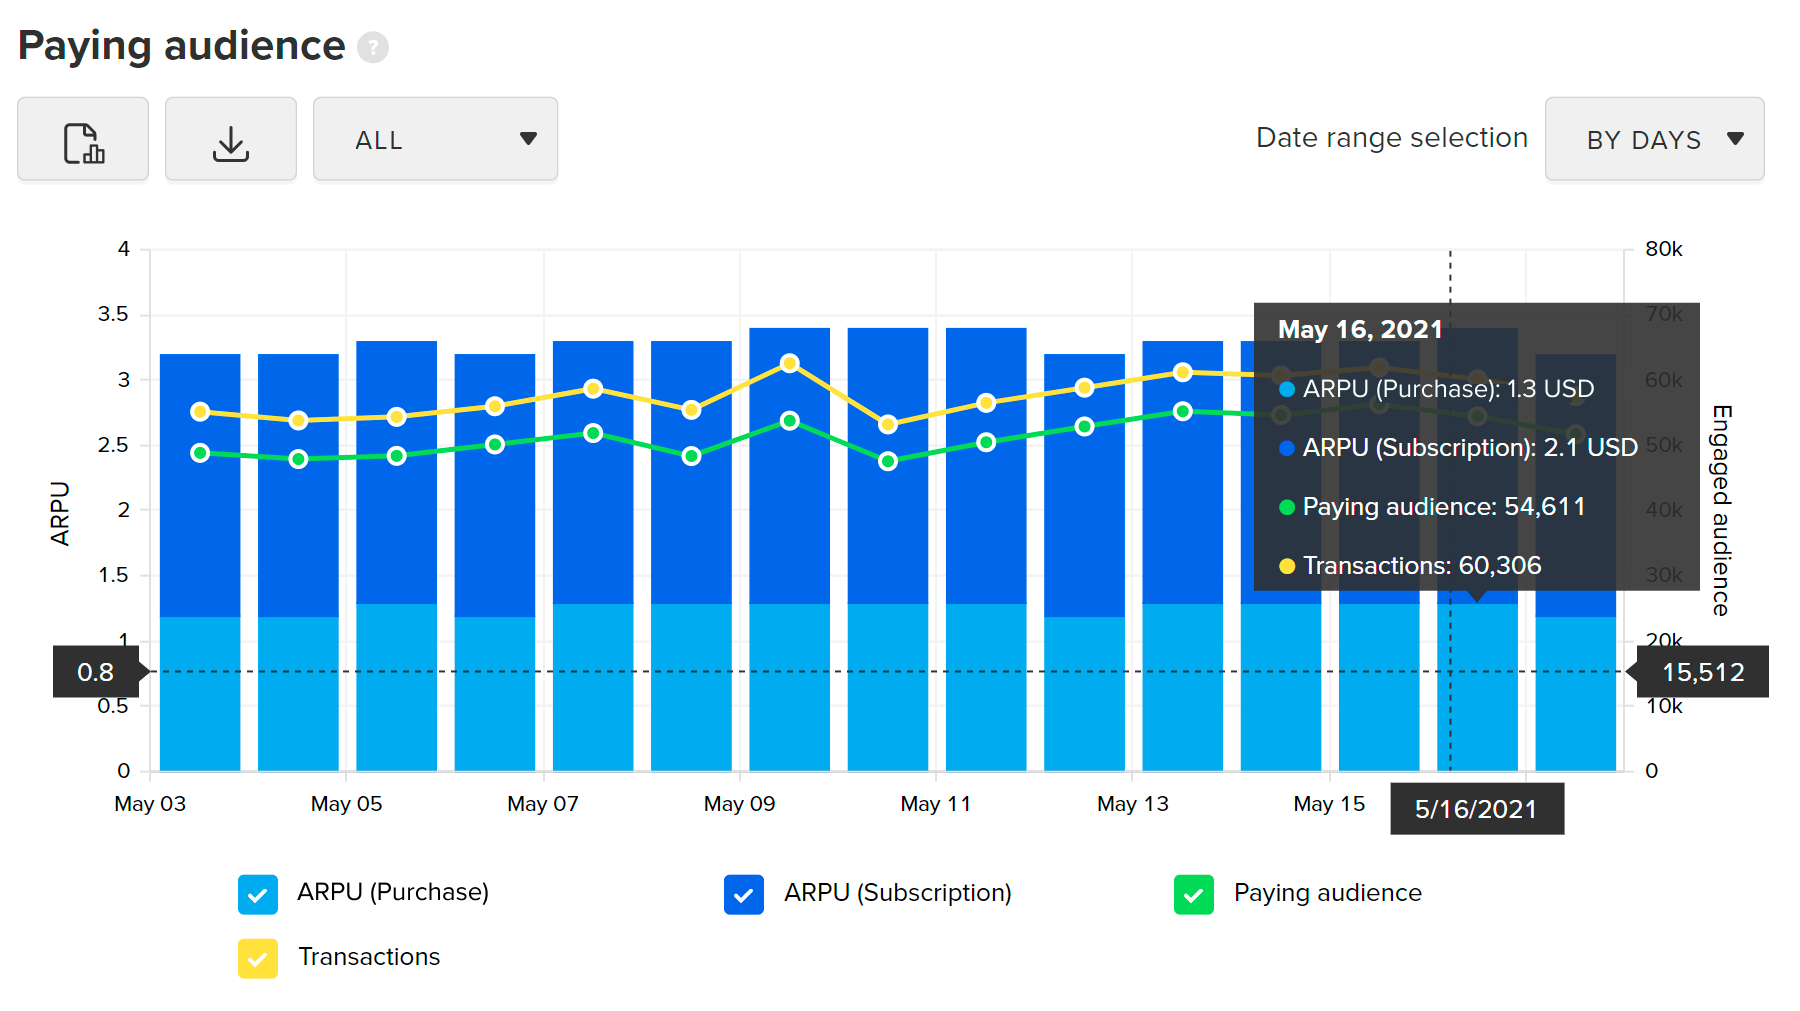
For instance, you can see the share of paying users in the Monetization section.
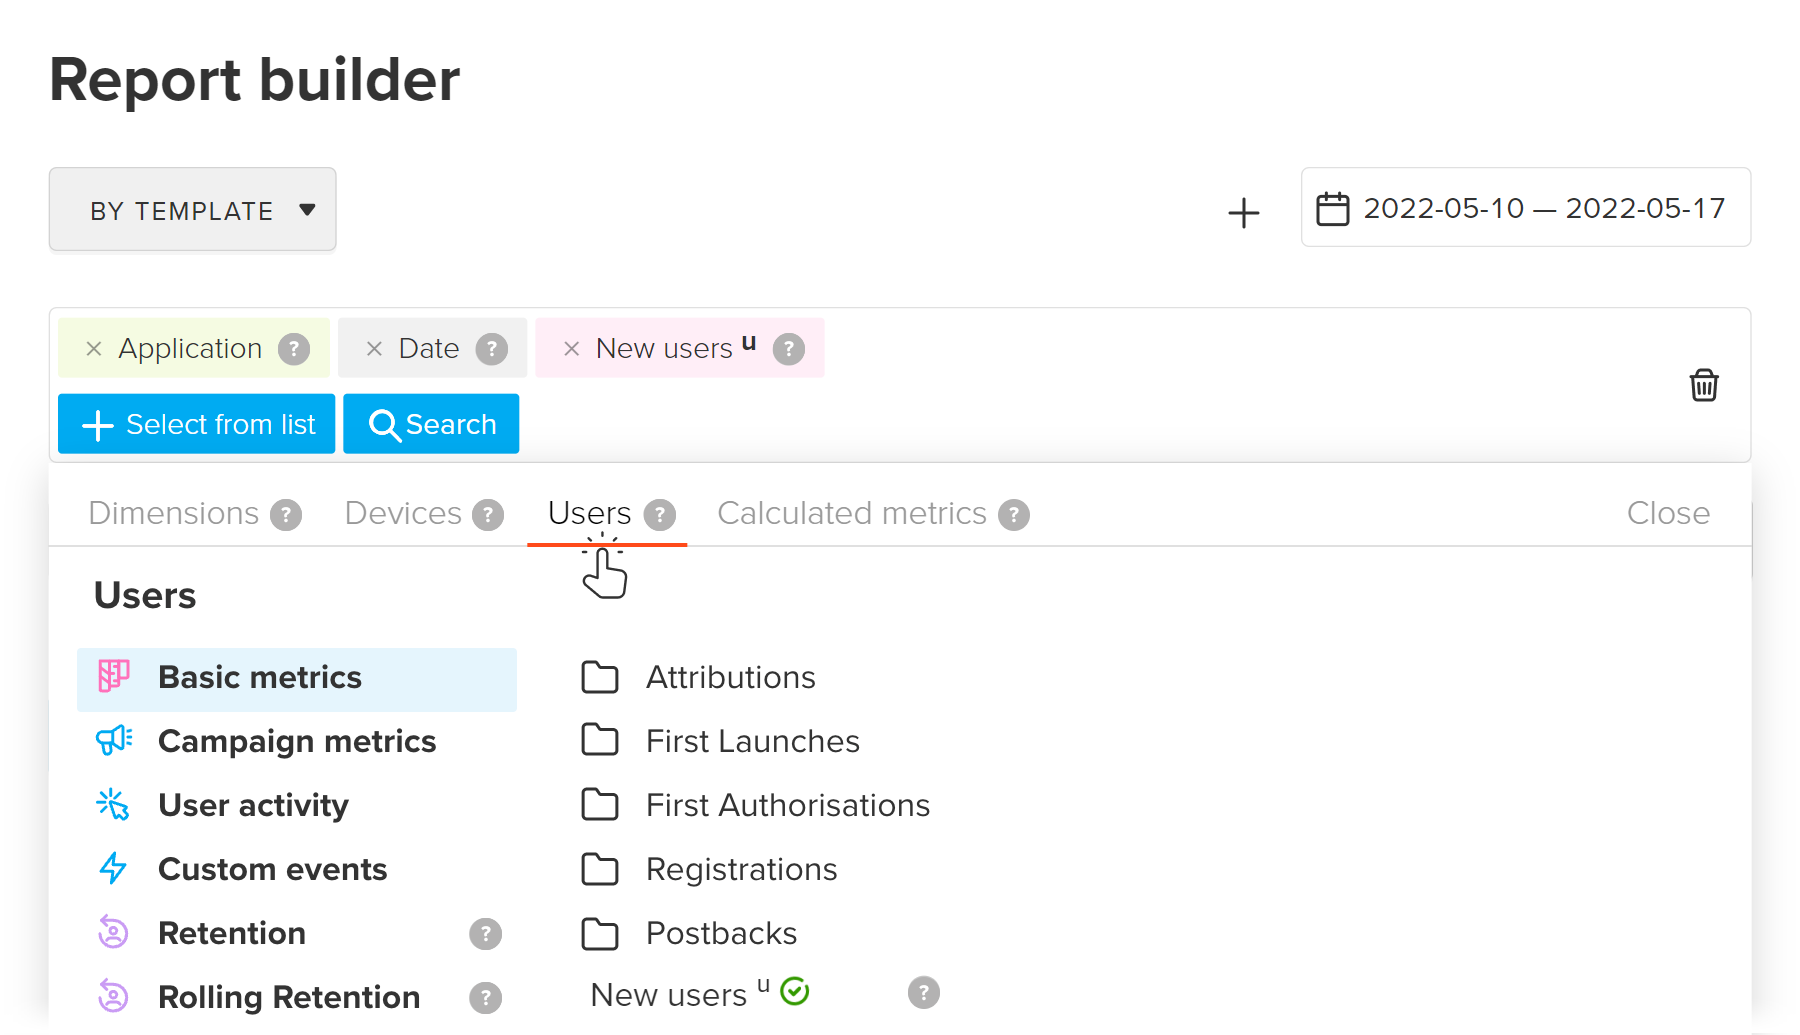
Report builder provides all user metrics on the Users tab. User metrics are marked with the superscript letters u (users).
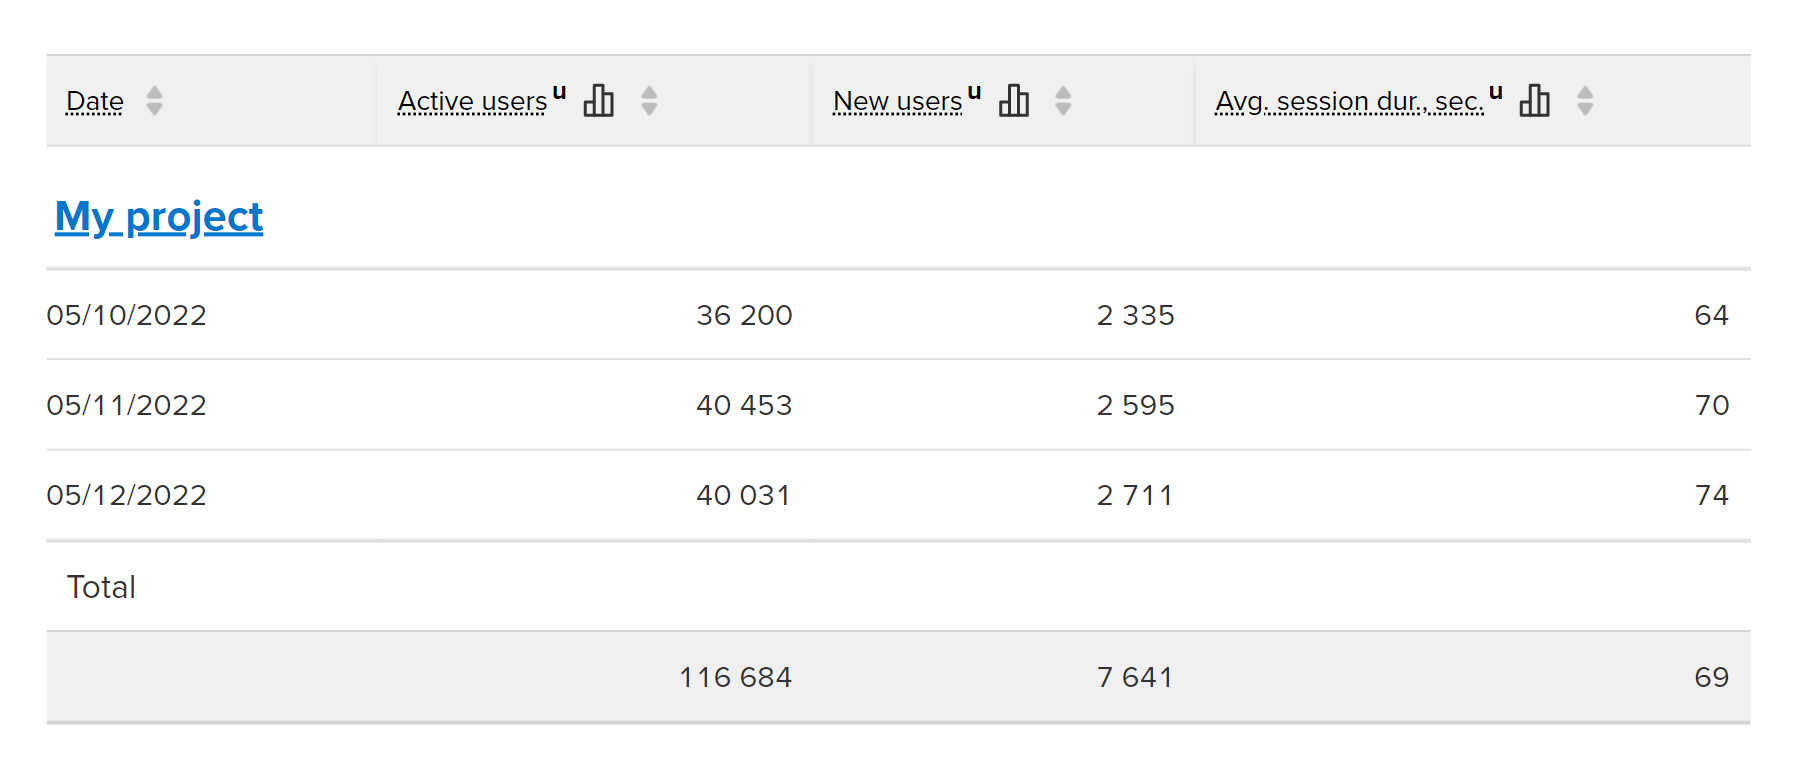
With the builder, you can pick up the metrics and dimensions you need. For example, to check the user activity in your project.
Segments and funnels allow you to analyze individual user groups and visualize their journey. To build a segment or funnel by users, in the add form, select Users in the Audience field.

For example, you can check the share of users who have completed some actions in the project.

For more details about MyTracker tools, refer to the Analytics section
Registrations confirm the user interest. Registrations are especially indicative for apps with optional authorization and for websites. For example, a first site visit does not guarantee continuous interaction with the app, whereas the registration signals the user's intention to use the product.
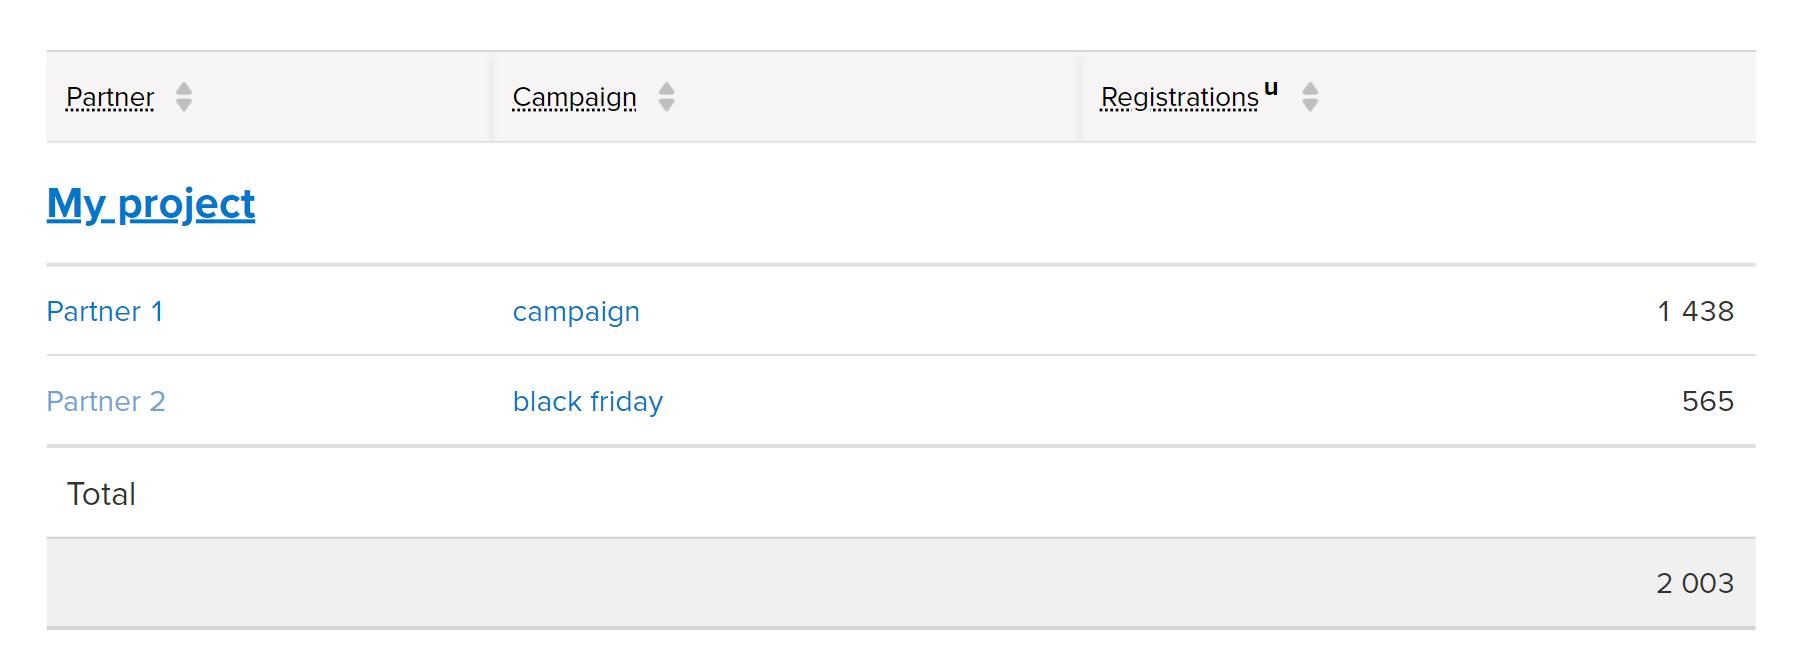
Compare the number of registrations in the context of partners and ad campaigns:
The Registration u metric includes only those registrations that are transmitted with the user ID
The New users metric shows the number of users who appeared in your project for the first time. Essentially, it is equal to Registrations, but includes more data, because for MyTracker the first user event can be not only a registration, but any other event, passed with the user ID first: payment, startup, custom event, etc.
The differences in New Users and Registration are possible for the following reasons:
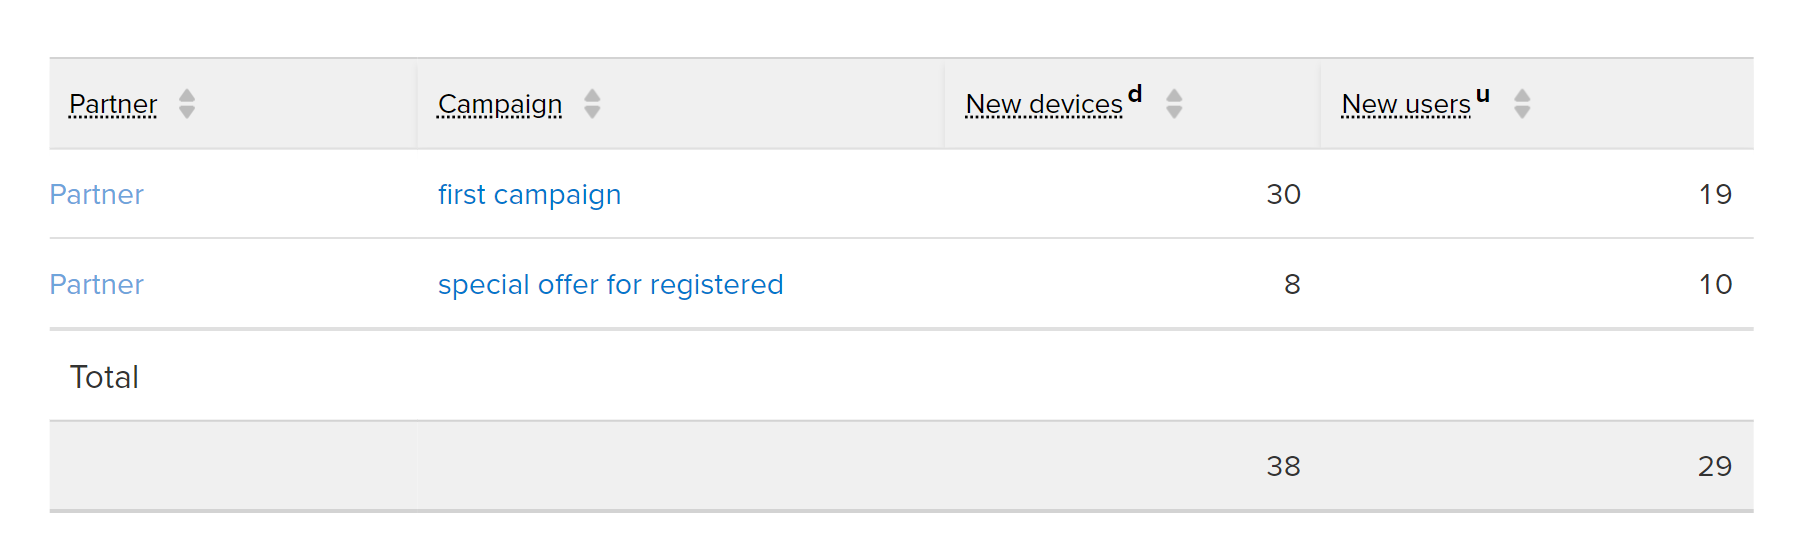
User metrics allow you to distinguish a new user from a device, for example, for cross-platform projects where the user can switch between the website and the mobile app and vice versa. For example, in the figure below, you can see that the first campaign brought in 30 new devices and only 19 new users.
Note that the ad campaign that led to the new user's registration may not coincide with the install/first site visit campaign in some cases. For example, a user may sign up a week after the first app launch by viewing a different ad.
The user attribution scheme was updated on April 29, 2022. Until then, new users and devices were always attributed to the same sources.
MyTracker supports a reattribution mechanism and specific metric types for evaluating remarketing campaigns.
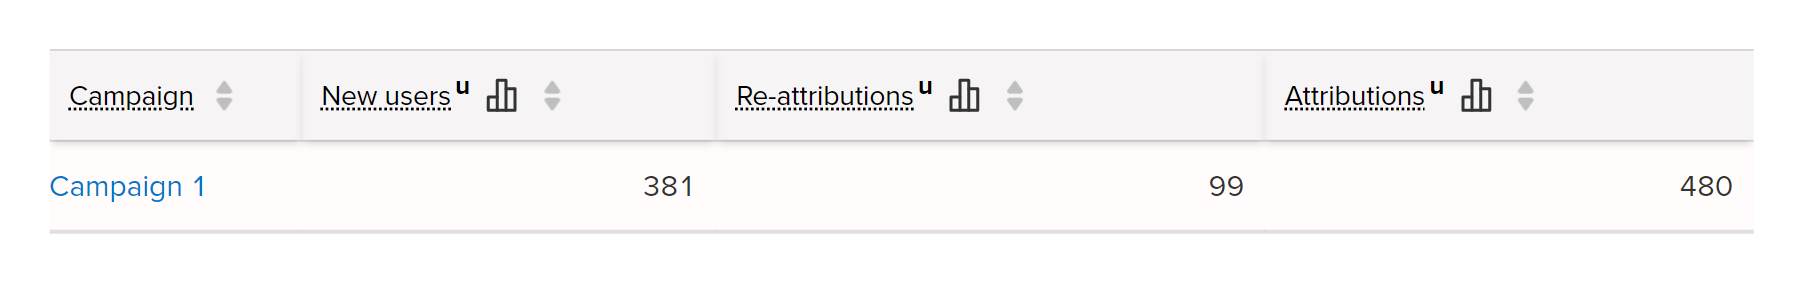
To see how the share of new and re-engaged users changes, you can use the metrics New users, Re-attributions, and Attributions. For example, in the figure below, you can see 99 re-engaged users from 480 engaged users.
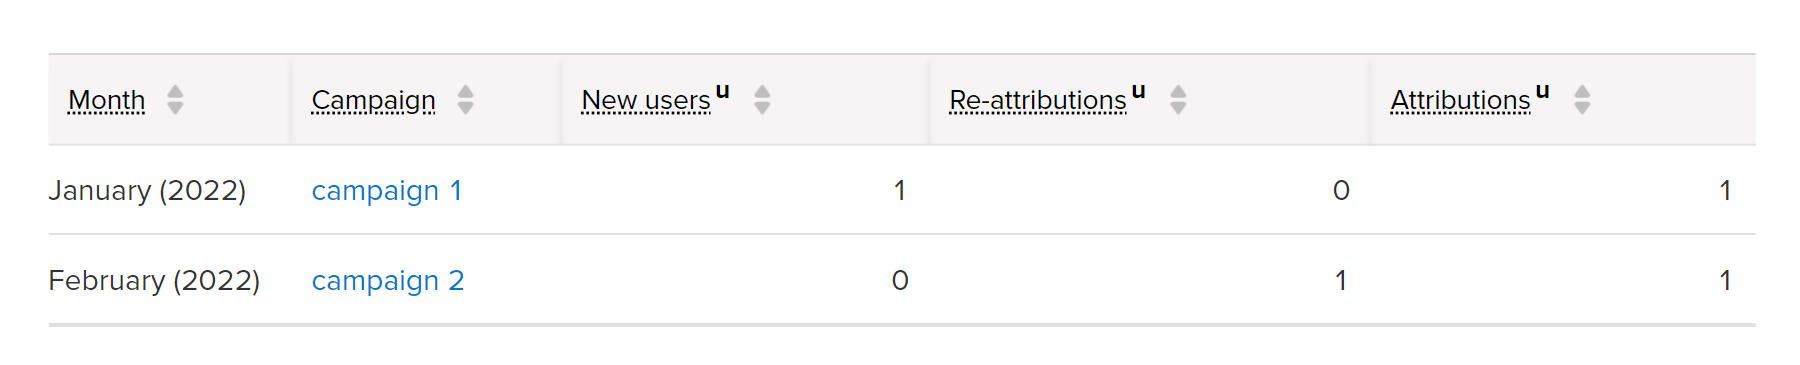
Consider how the audience share changes based on the example of one user. The figure below shows that the user signed up in January as a result of the ad campaign 1 (new users = 1), at some point the user stopped interact with the app, but they returned to the project in February as a result of campaign 2 (re-attributions = 1).
To analyze remarketing campaigns, use metrics AT (Attribution time) and CA (Current Attribution).
For example, in the figure below, the LTV 5d metric shows revenue for 5 days from new users only, the LTV AT 5d metric shows total revenue from new and re-engaged users.
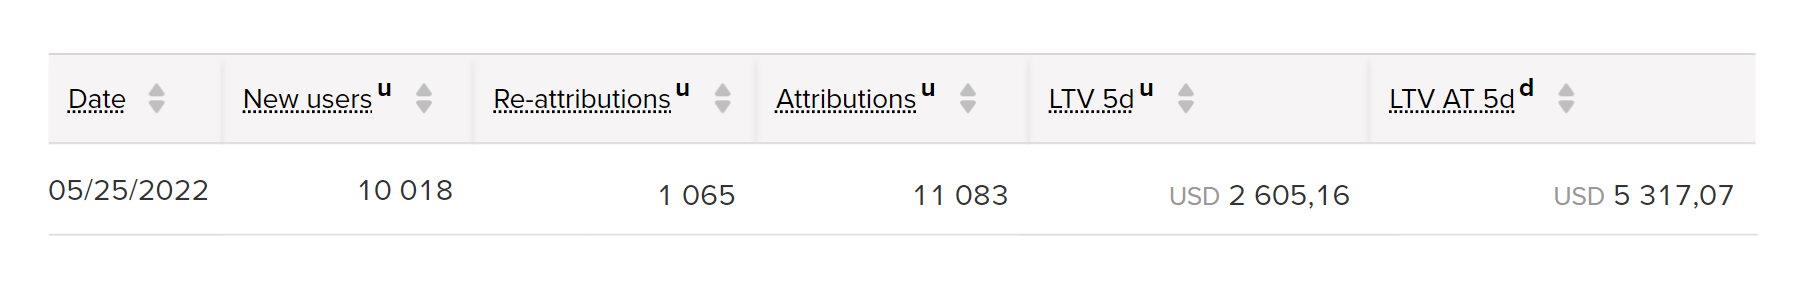
LT-metric is related to the first attribution (to new users), AT-metric is related to the current attribution and counts for all users attributed in the selected report period (no matter for the first time or repeatedly). For more details, see the Metric types section
For any project, it is useful to compare user and device metrics and understand reasons for the differences. For example, to distinguish the number of new users from users who switched devices.
Consider the New Users and New Devices metrics.
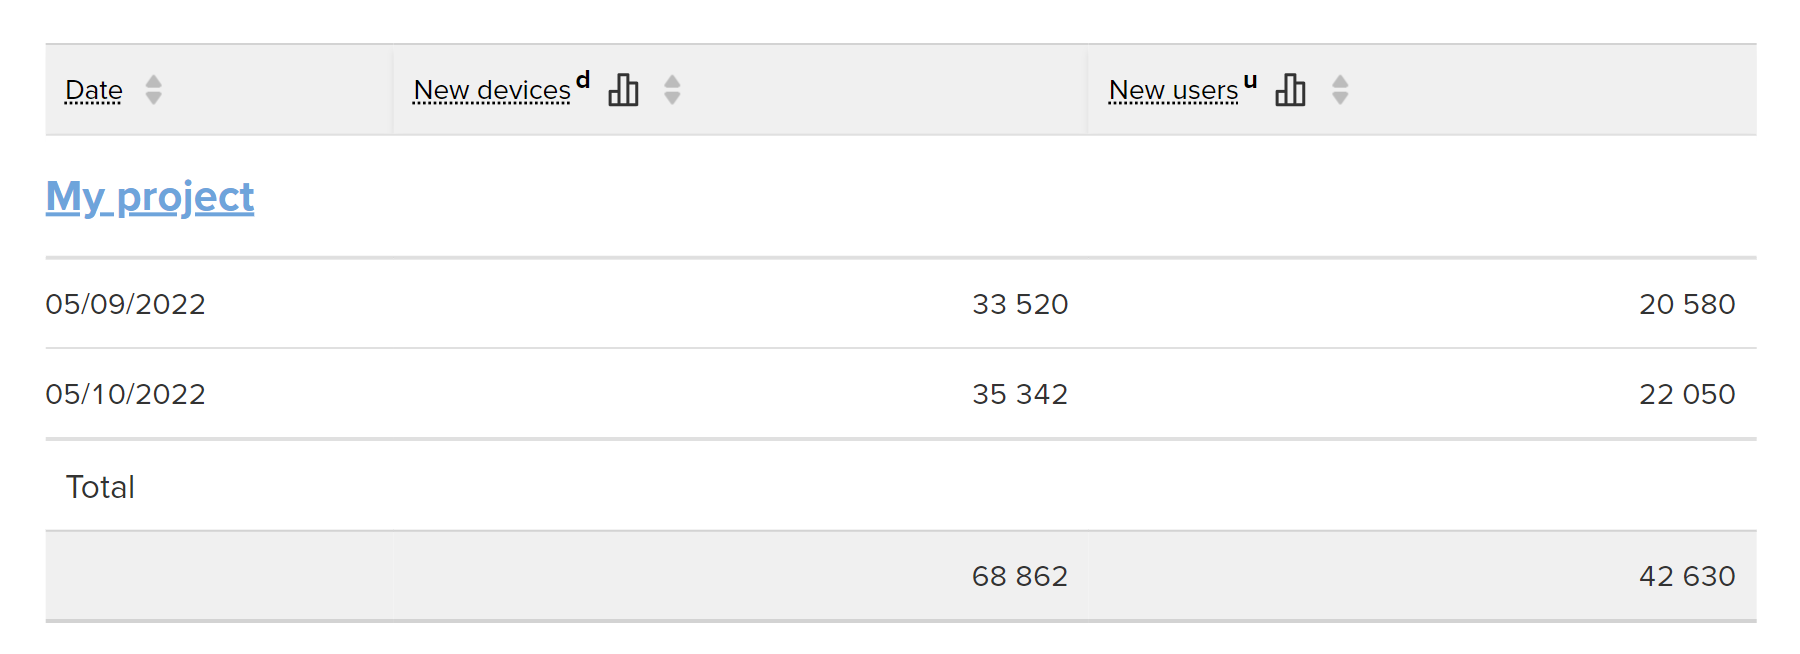
More often, the number of new devices exceeds the number of new users. There are several reasons for this:
Many of the above reasons are relevant when comparing any d(device)- and u(user)-metrics, such as Launches, Events, etc.