The Retention and Rolling Retention metrics show the percentage of the audience who still use an app over time. Analyze these metrics to keep users engaged for longer:
MyTracker provides all tools for analysis, shows you stats by physical devices and authorized users, by installs and attribution, in detail by hours, days, weeks, months.
Retention (RET) shows the percentage of new audiences that return to the project in a specified time frame. These are users who have appeared in the selected report period and were active later, in specific hours, days, weeks, or months.
RET* – LifeTime metric
RET AT* – Attribution Time metric
Let's consider Retention for the first, second, ... and sixth days after users appear. Hover over the summary rows of the table:
| Day 0 |
Day 1 | Day 2 | Day 3 | Day 4 | Day 5 | Day 6 |
|---|---|---|---|---|---|---|
| User 1 | ||||||
| User 2 | ||||||
| User 3 | ||||||
| User 4 | ||||||
| Retention |
2 of 4 50% ? |
3 of 4 75% ? |
1 of 4 25% ? |
1 of 4 25% ? |
1 of 4 25% ? |
2 of 4 50% ? |
To view the Retention report, use Builder and Reports.
Reports displays how the share of returning audiences changed over 48 hours, 30 days, 26 weeks, or 24 months. To open the report, select the Reports → Retention menu.
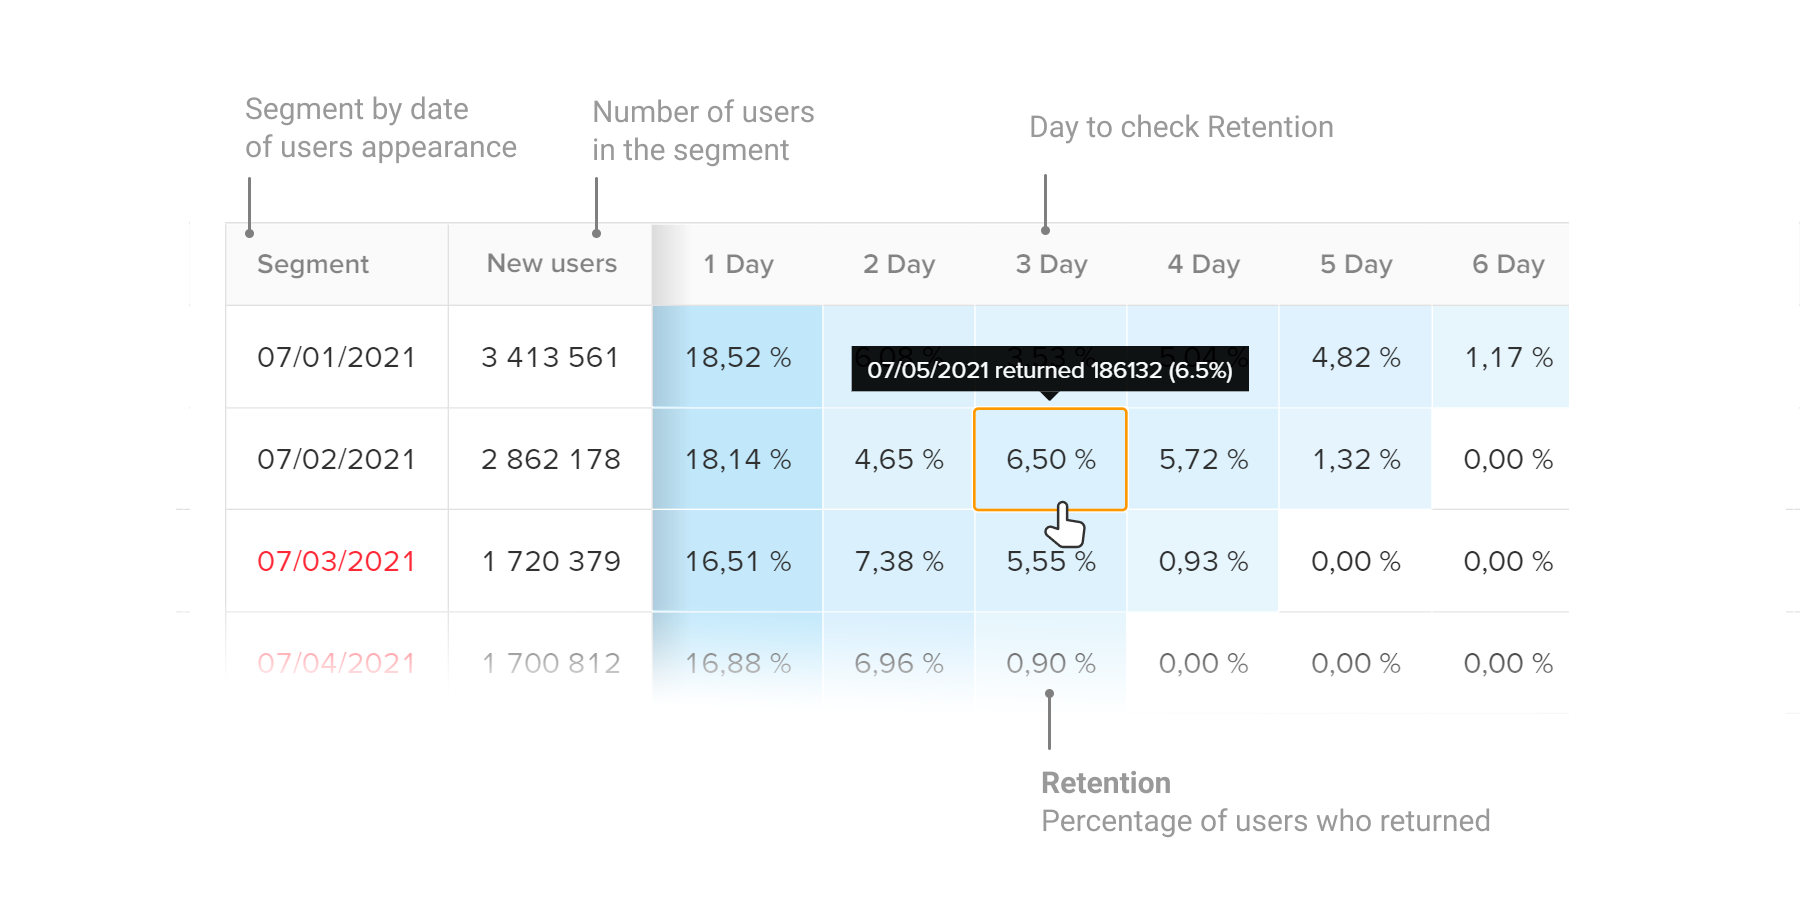
If you are building a report for the last few days, the tooltip may point to tomorrow. It is not a forecast, but the actual data obtained for the already started 24-hour interval for the Retention calculation. Remember that Retention is calculated not by calendar days but by 24-hour intervals.
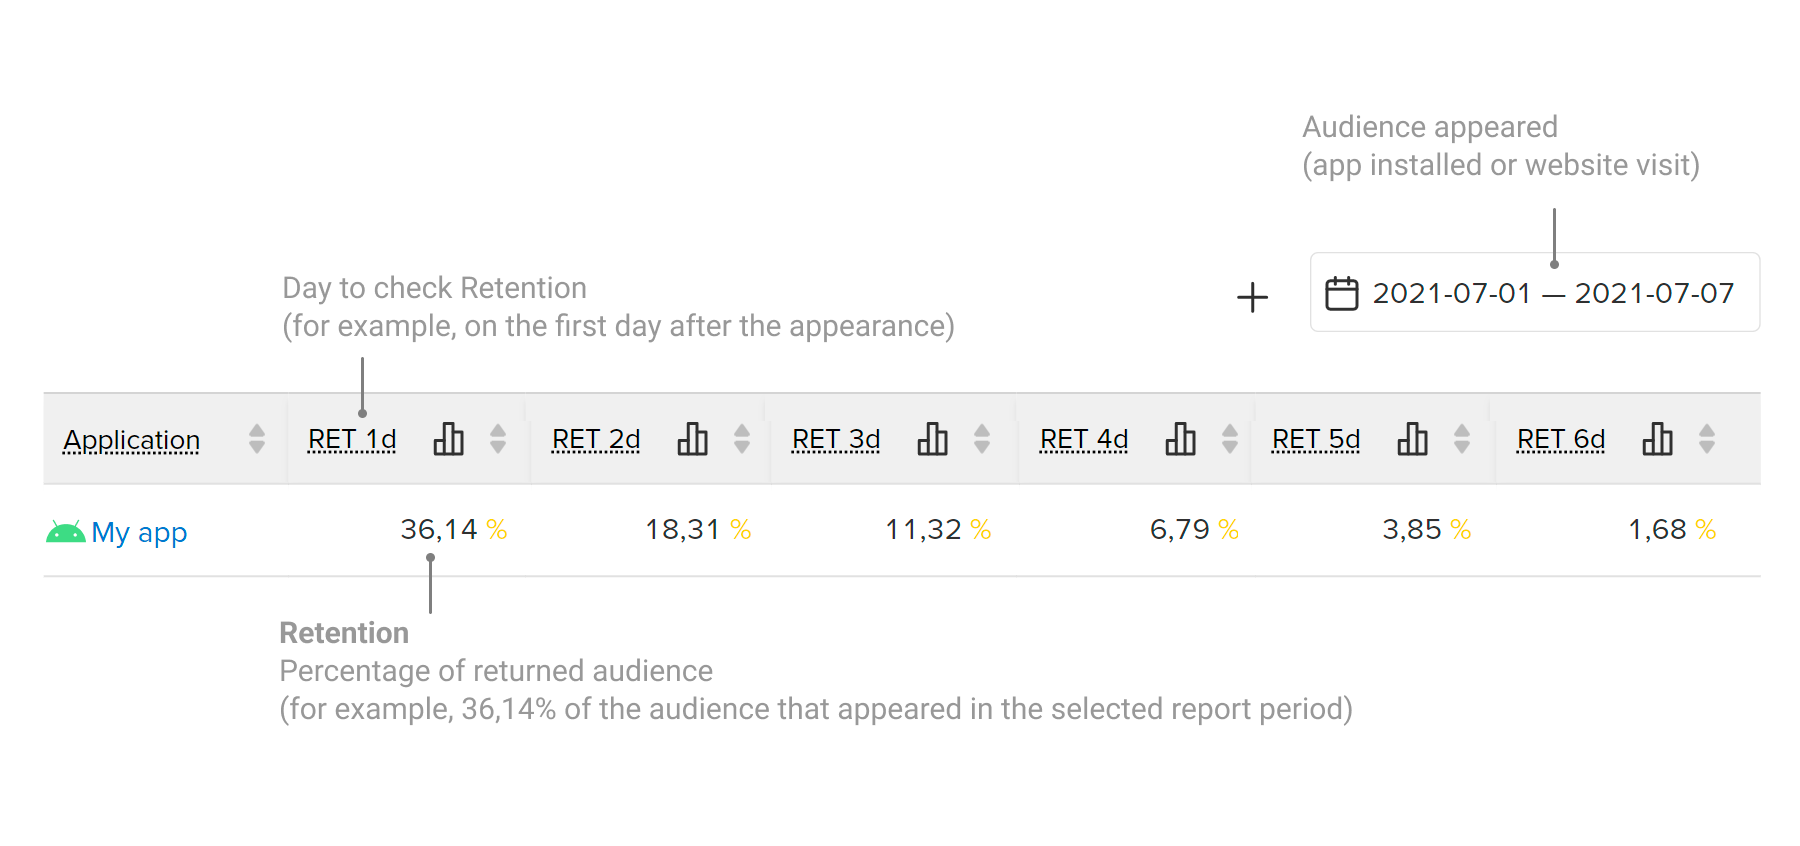
Report builder provides more instruments for Retention analysis. For example, you can see stats by campaigns and countries, group results, and compare data for several periods. The figure below shows how to read the report in a simple form.
Retention template shows stats on user retention in the first 30 days after appearance. To open the template, select the Analytics → Templates → Retention menu.
For details about Reports, Builder, and Templates, see the Analytics section
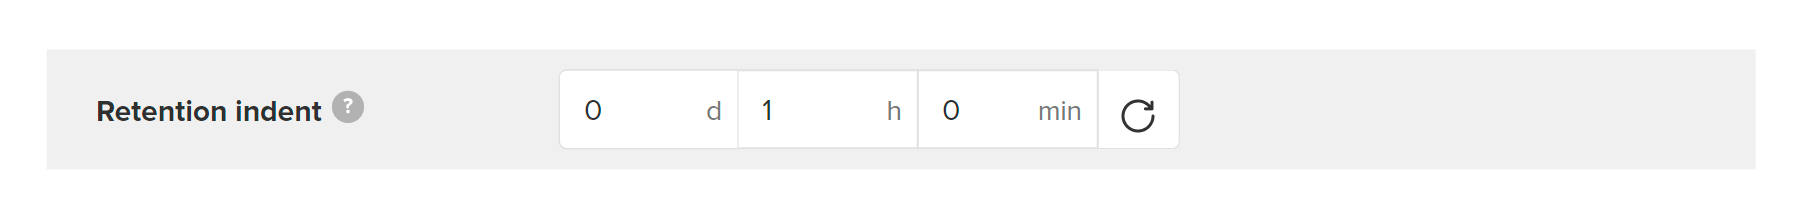
By default, MyTracker calculates Retention with a Retention indent equal to 1 hour. This is to avoid inflating the RET for the first time after the audience appears when users are just getting acquainted with the app (otherwise Retention for the first hours, days, weeks will always be 100%).
For example:
You can set up a Retention indent for all MyTracker reports at once or for a separate report in the Report builder. You can also reset the Retention indent to default values by clicking . For more details, refer to the Settings section.
Should not compare Retention and Churn rate. Metrics describe intersecting but a different audience.
Retention
shows "the viability" of a new audience.
This metric is calculated by those users who installed a mobile app or visited the site for the first time during the selected report period.
Churn rate shows "losses" among an active audience of your project. This metric is calculated by those users
who shown any activity in the selected report period: launch, payment, authorization, etc.
For details, see the Churn rate section
Rolling Retention (RR) shows the percentage of new audiences that return to the project after a specified time frame. These are users who have appeared in the selected report period and were active after specific hours, days, weeks, or months or later.
RR* – LifeTime metric
RR AT* – Attribution Time metric
Let's consider Rolling Retention for the first, second, ... and sixth days after users appear. Hover over the summary rows of the table:
| Day 0 |
Day 1 | Day 2 | Day 3 | Day 4 | Day 5 | Day 6 |
|---|---|---|---|---|---|---|
| User 1 | ||||||
| User 2 | ||||||
| User 3 | ||||||
| User 4 | ||||||
| Retention |
2 of 4 50% ? |
3 of 4 75% ? |
1 of 4 25% ? |
1 of 4 25% ? |
1 of 4 25% ? |
2 of 4 50% ? |
| Rolling Retention |
3 of 4 75% ? |
3 of 4 75% ? |
3 of 4 75% ? |
3 of 4 75% ? |
2 of 4 50% ? |
2 of 4 50% ? |
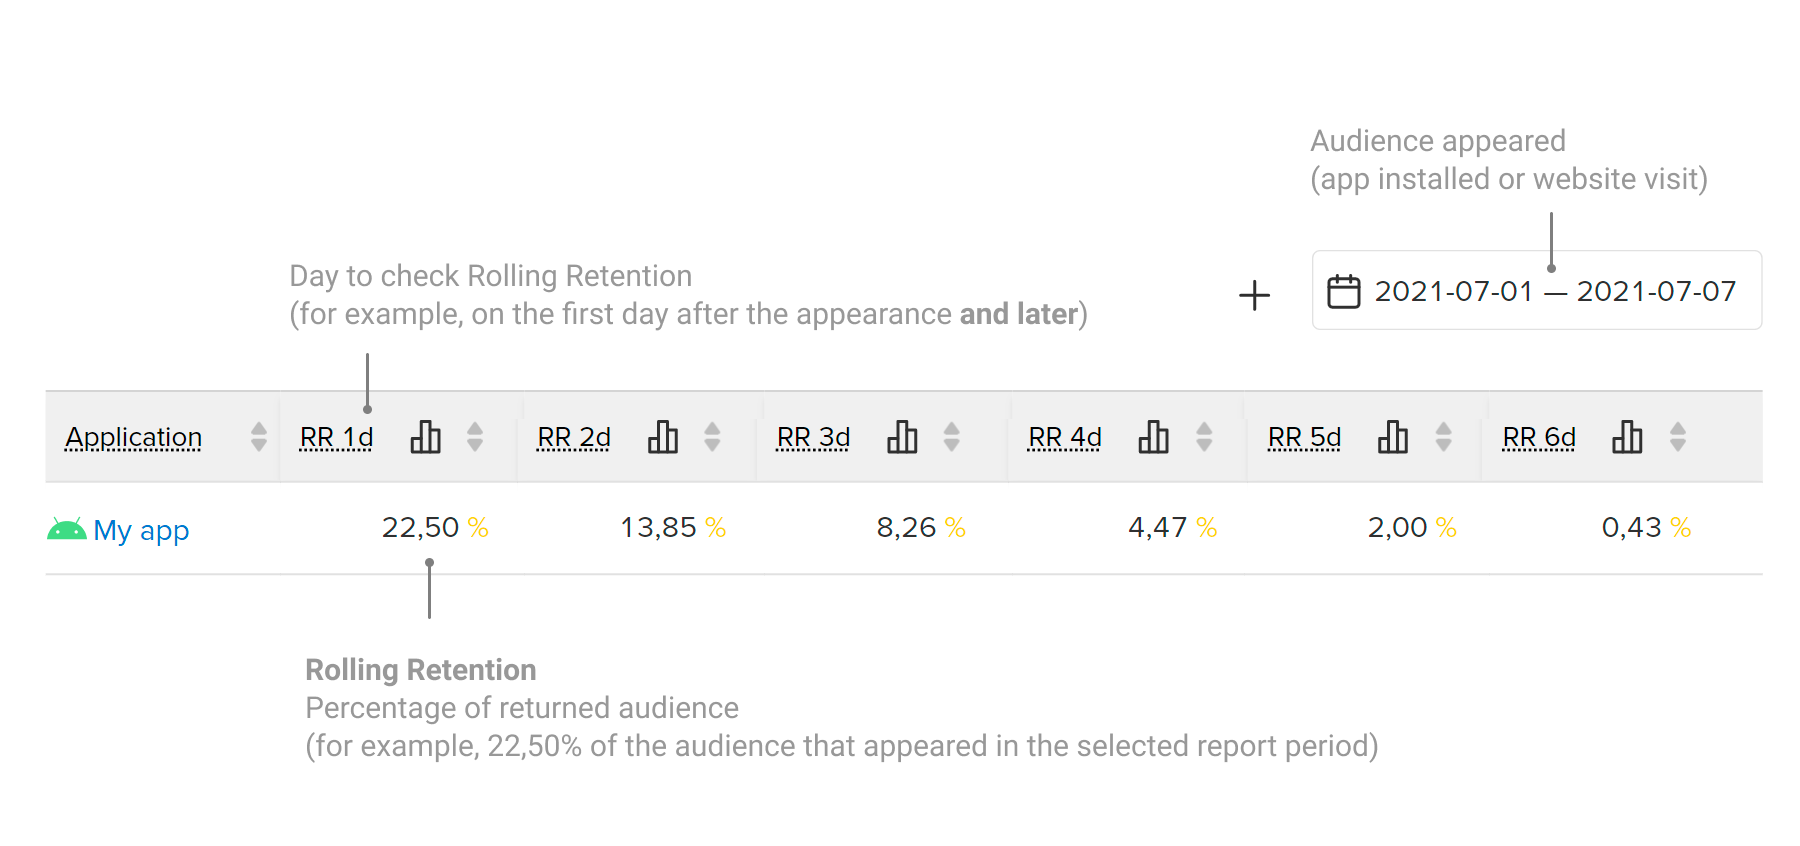
To view the Rolling Retention report, use Builder. Unlike Retention (RET), Rolling Retention (RR) can make allowance audience activity up to the moment when you build a report, that helps to track activity extinction over time.
The figure below shows how to read the report in a simple form.
By default, Rolling Retention (RR) takes audience activity up to the moment when you build a report. But you can limit RR period in the Report builder via Settings.
For example:
Note that both the RR period and the limitation period are deferred since the user appeared.
RR limit must not be less than the RR period otherwise, the indices will be equal to zero. For example, for RR2m the RR limit must be greater than 2 months as both periods are deferred since the user appeared.
Use-case for RR limit
You should limit RR if you want to compare Rolling Retention for different dates. For example, let's compare the RR for an airline ticket app in 2020 and 2021:
No RR limit:
The RR for 2020 is higher only because more time has passed from 2020 to now than from 2021. RR takes any activity up to today into account without limitation.
RR limited at 6m:
With the RR limit, we set the frame at six months since the user appeared. And were able to see that the RR in 2021 is higher than the RR in 2020, which reflects the realistic picture, as the number of air travel was reduced in 2020.
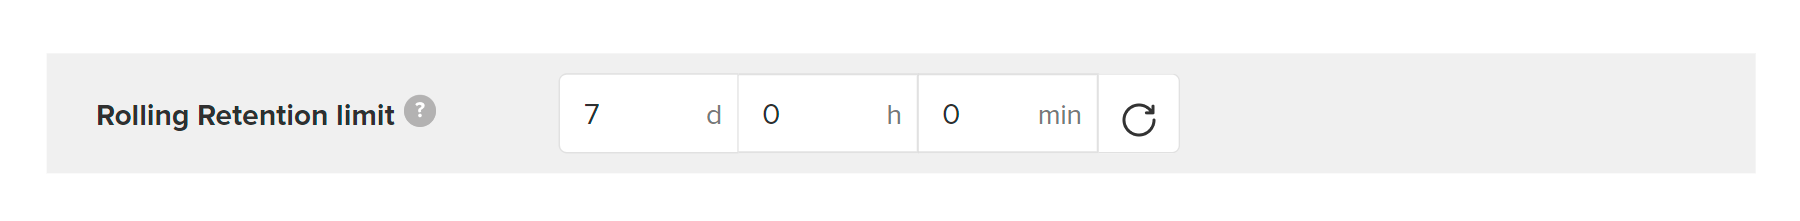
You can set up Rolling Retention limit for all MyTracker reports at once or for a separate report in the Report builder. You can also reset values to default by clicking . For more details, refer to the Settings section.
The key difference between Retention (RET) and Rolling Retention (RR) metrics is that the RR builds on users who returned to the app on a particular day or any subsequent day, up to the moment of report building (if RR limit is not set).
For example, if a user returned to the app only on the 3 day after the first appearance, then RET 2d will be zero, and RR 2d will be higher than zero, since it will count the activity of the third and all subsequent days.
Rolling Retention is convenient for analyzing apps with irregular usages, such as airline ticket sales or device cleaning apps. RR shows that the user may not run the app every day but continues to use it.
Retention is important for apps that involve daily use, such as games, mail, and social networking. RET shows the change in the percentage of audience returning from day to day, as well as the users who return to the app in a specific period, as a result of promotions, for example.
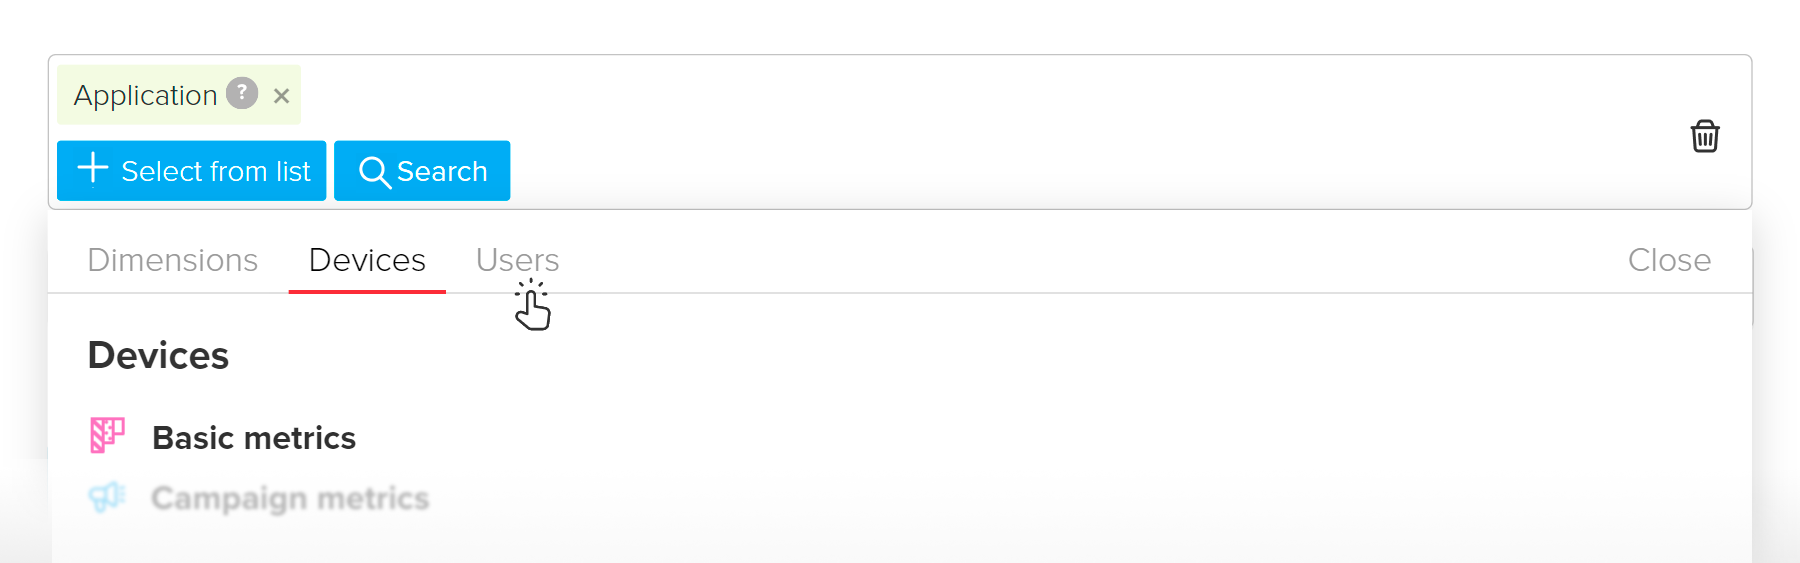
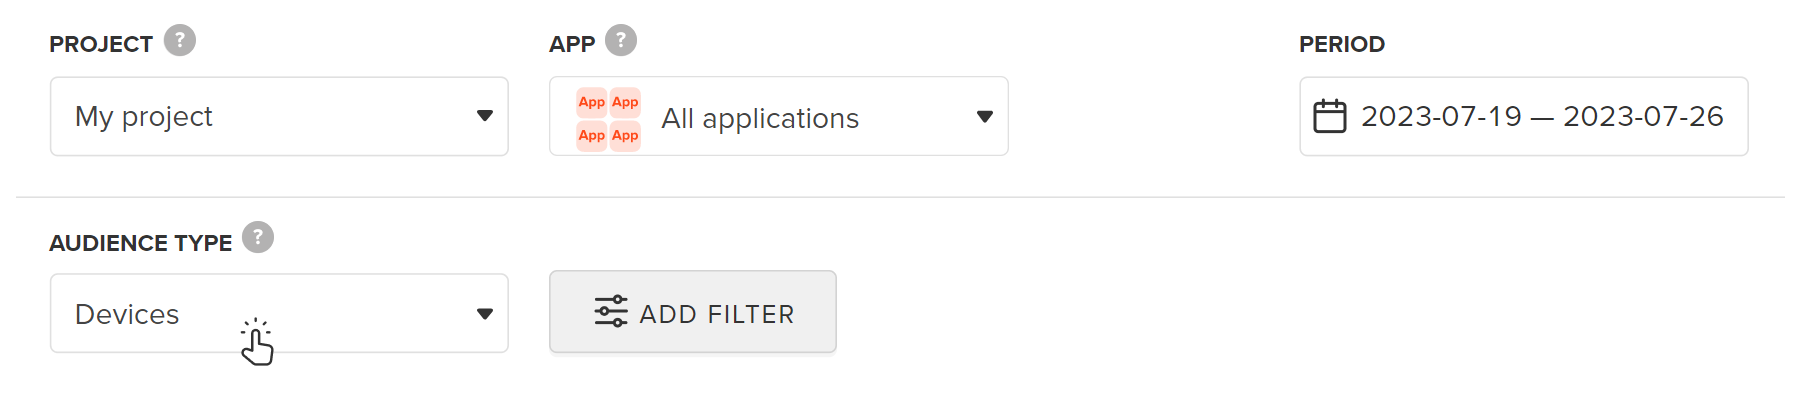
Retention & Rolling Retention in MyTracker can be counted:
You can switch metrics on the tabs in Builder and in the top panel of the Report.
RETd & RRd show the percentage of physical devices (smartphones, laptops, etc.) whose users continue to use the app. But a user can have one and more devices, and some switch or upgrade their devices.
RETu & RRu show the actual volume of the audience retention — data on user accounts. If your app supports authorization, you can pass user IDs to MyTracker and track the user by smartphone and laptop, and keep tabs on the exact number of your customers even if they switch devices. To learn more see the User tracking section.
RETp & RRp show the percentage of audience that continues to use the app on platforms like VK Play and VK Mini Apps.
Why am I seeing Retention for tomorrow (week, month)? Is it a prediction?
No. The thing is, Retention is calculated not by calendar days but by 24-hour intervals. So if you are building a report for the last few days, you may think you are seeing Retention for future periods (tomorrow, next week, etc.). RET takes into the activity of the 24-hour interval that has already begun today, and the data for the next day, week, or month is not yet complete.
For example, if you are building a report for yesterday, then RET2d is Retention on the second day after the user appears and not for tomorrow.
See our blog post: