Reports present interactive data visualization and rapid analytics.
The main statistical data can be shown as a simple table, diagram, and graph.
On a single report panel you can change data display format,
report period and if necessary go to the Builder to add more dimensions and metrics.
The reports you see depend on the list of selected applications.
For example, in the Traffic Acquisition report, the Mobile remarketing block is only for mobile applications, and the Web traffic is only for sites.
What to see
Audience Overview shows the user profile (activity, gender, age, geolocation, session duration, and project platform).
Traffic Acquisition shows the effectiveness of the advertisement.
Find out which traffic sources bring more users and evaluate the acquisition dynamics.
Events show the number of users or devices that have completed the target events. You can also analyze data by event parameters.
Devices are technical overview for mobile, laptop, and other user equipment (app versions, OS, network types, carriers, models, and screen resolution).
Retention shows the ability of the app to retain users.
Monetization shows the financial statement of the project.
SKAdNetwork shows SKAN conversions data that allows to evaluate the effectiveness of the ad campaign for the iOS 14.5+ devices.
Fraud Scanner displays fraud data detected from the incoming traffic. Based on this indicators, you can review the partner collaboration and do not pay for fraudulent traffic.
Insights shows statistics on interests and demographic data of your audience.
Ecommerce shows data for online stores: order statuses, product returns, expected revenue, and losses.
How to use
Select the section from the Reports menu.
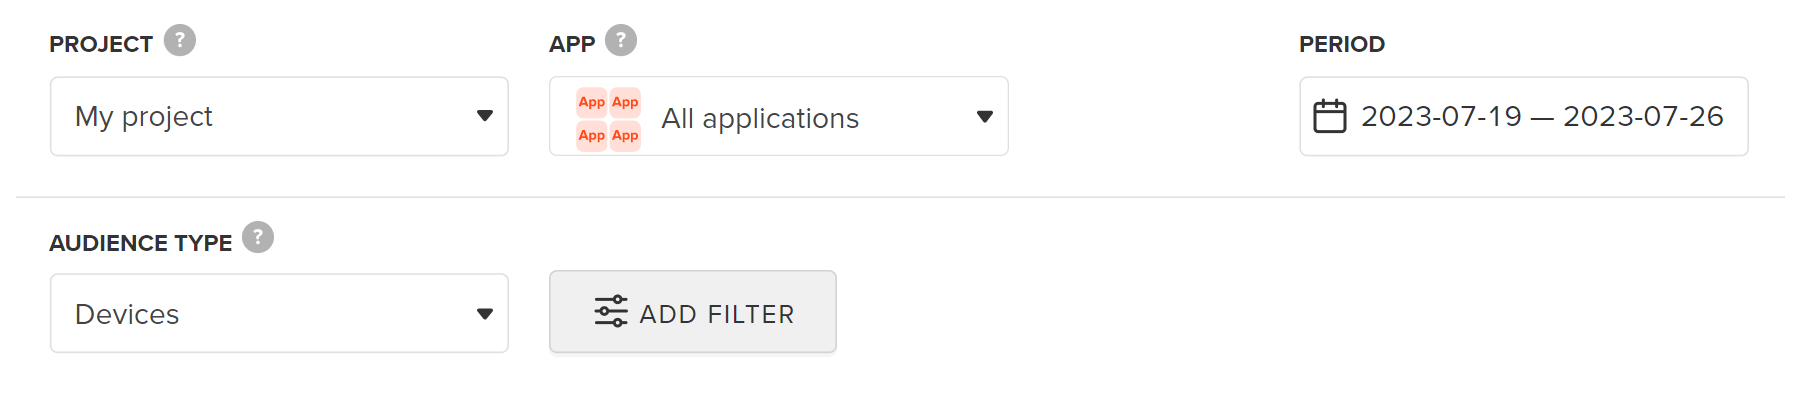
You can use the drop-down list to change the project or app on which to build the report. Set the report period.
Some reports are only available when you analyze projects and other — for separate platforms (mobile and web).
For example, Audience by platform is only for a project.
Click Add filter to select filters. Conditions will apply to all reports of the section.
Set up each report as you need:
,
— exclude/include dimensions and metrics, clicking on the names;
— go to the builder and add any dimensions or metrics;
— download a report in one of the following file formats — XLSX, PDF, PNG, or SVG;
and etc. — see data in the form of diagrams, tables and graphs;
by daysaudience and etc. — change details and type of analyzed data.
MyTracker applies settings, such as currency, Retention indent, Rolling Retention limit, etc.,
configured in a user profile when building reports,
unless other settings are configured on the report page.