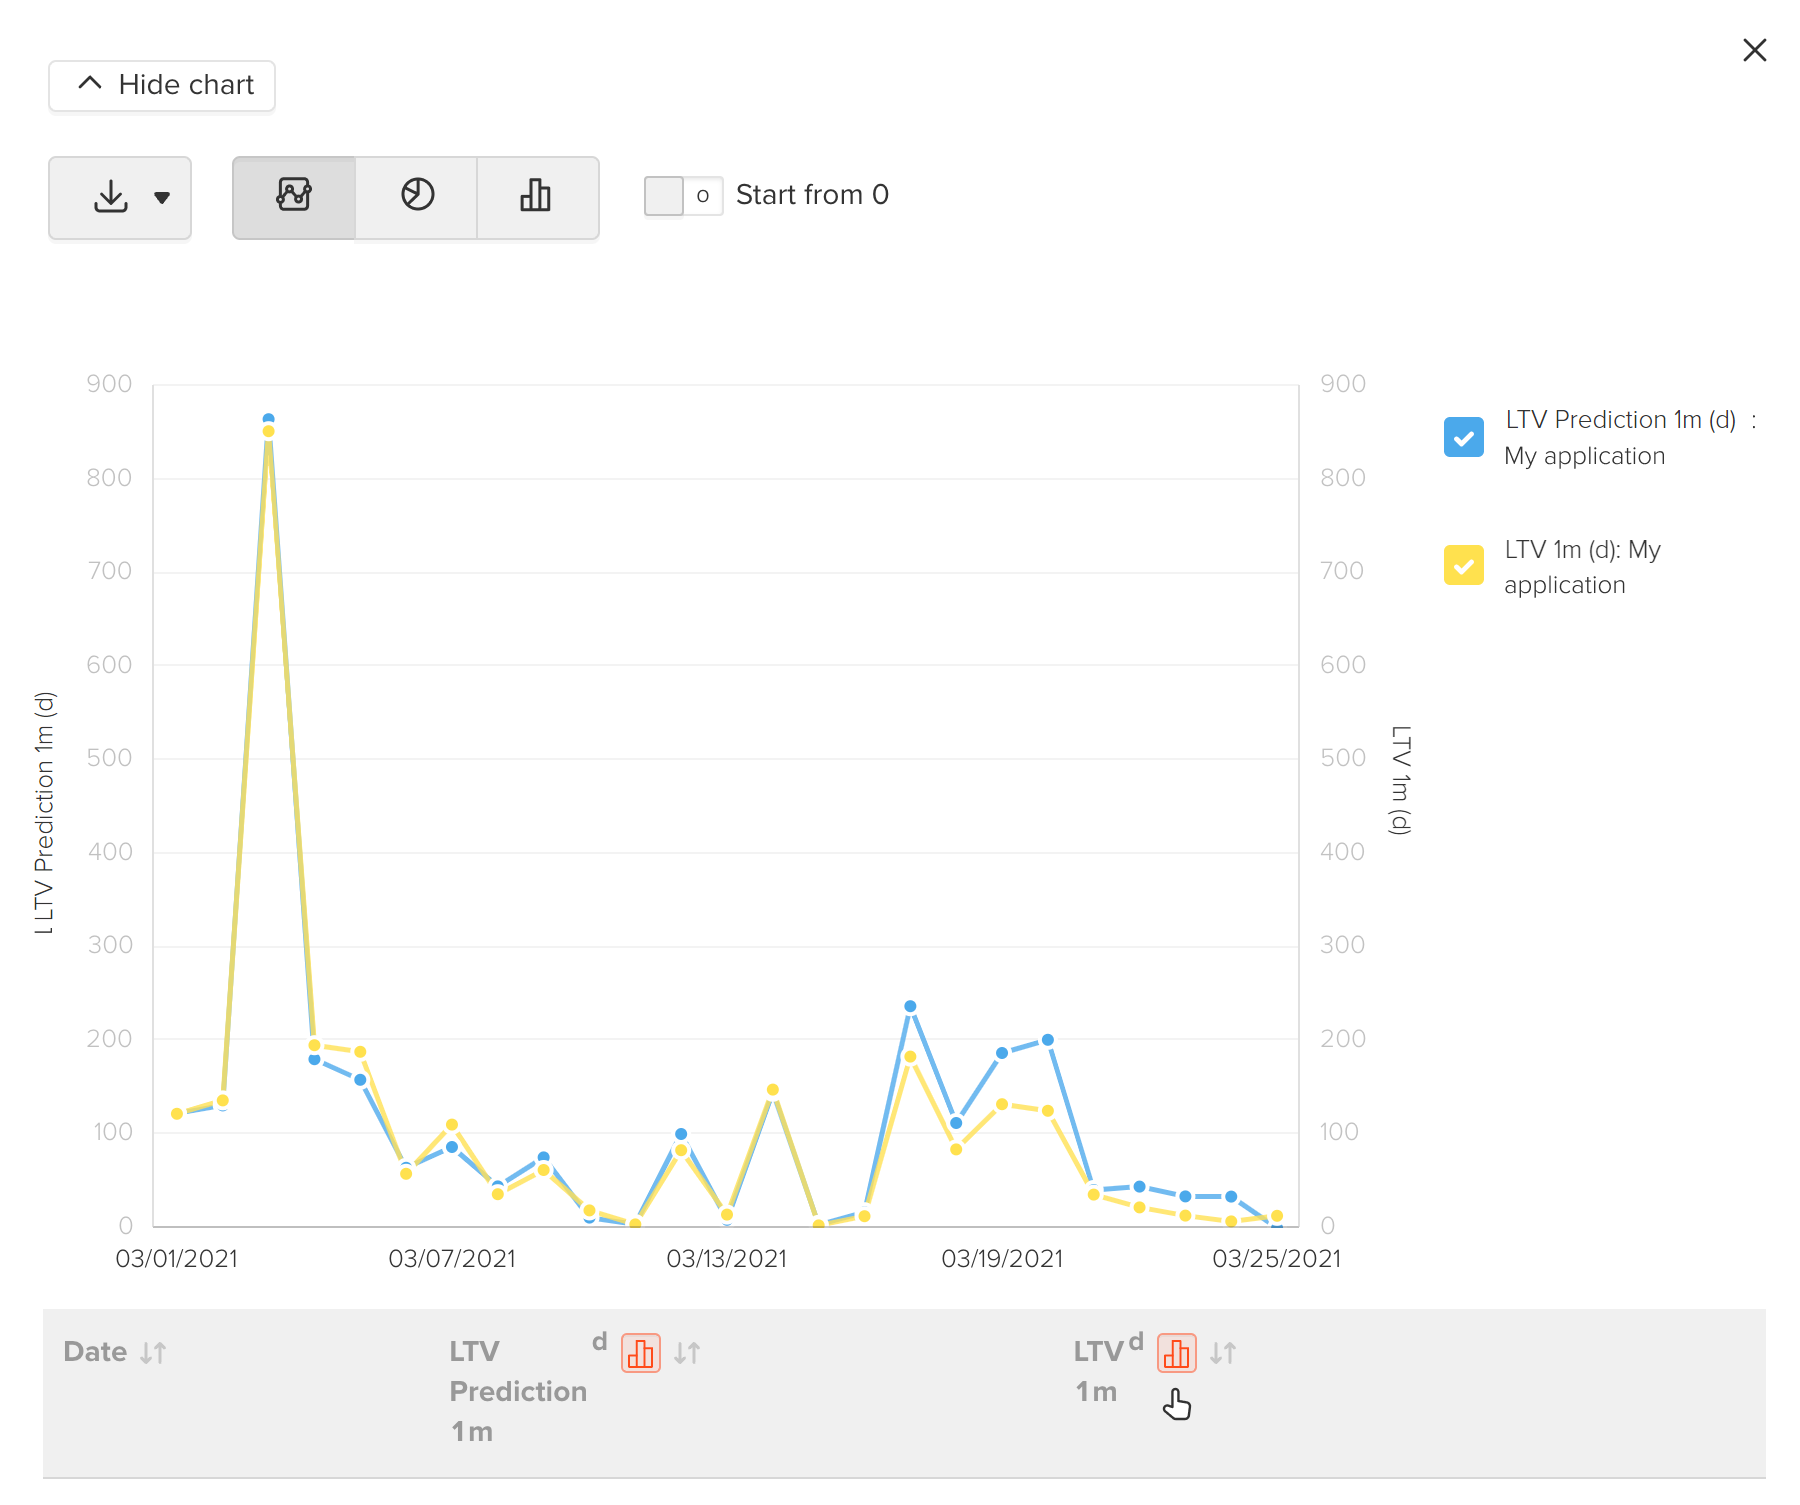
A comparison of facts and forecasts help you asses prediction. You can build a report in the MyTracker interface and calculate the weighted average error as described below.
We recommend assessing dimensions that you usually use. So you get an accurate assessment of decisions taken, find dimensions with serious fluctuations, and know weak spots of predictive models.
Build a comparison report in MyTracker:
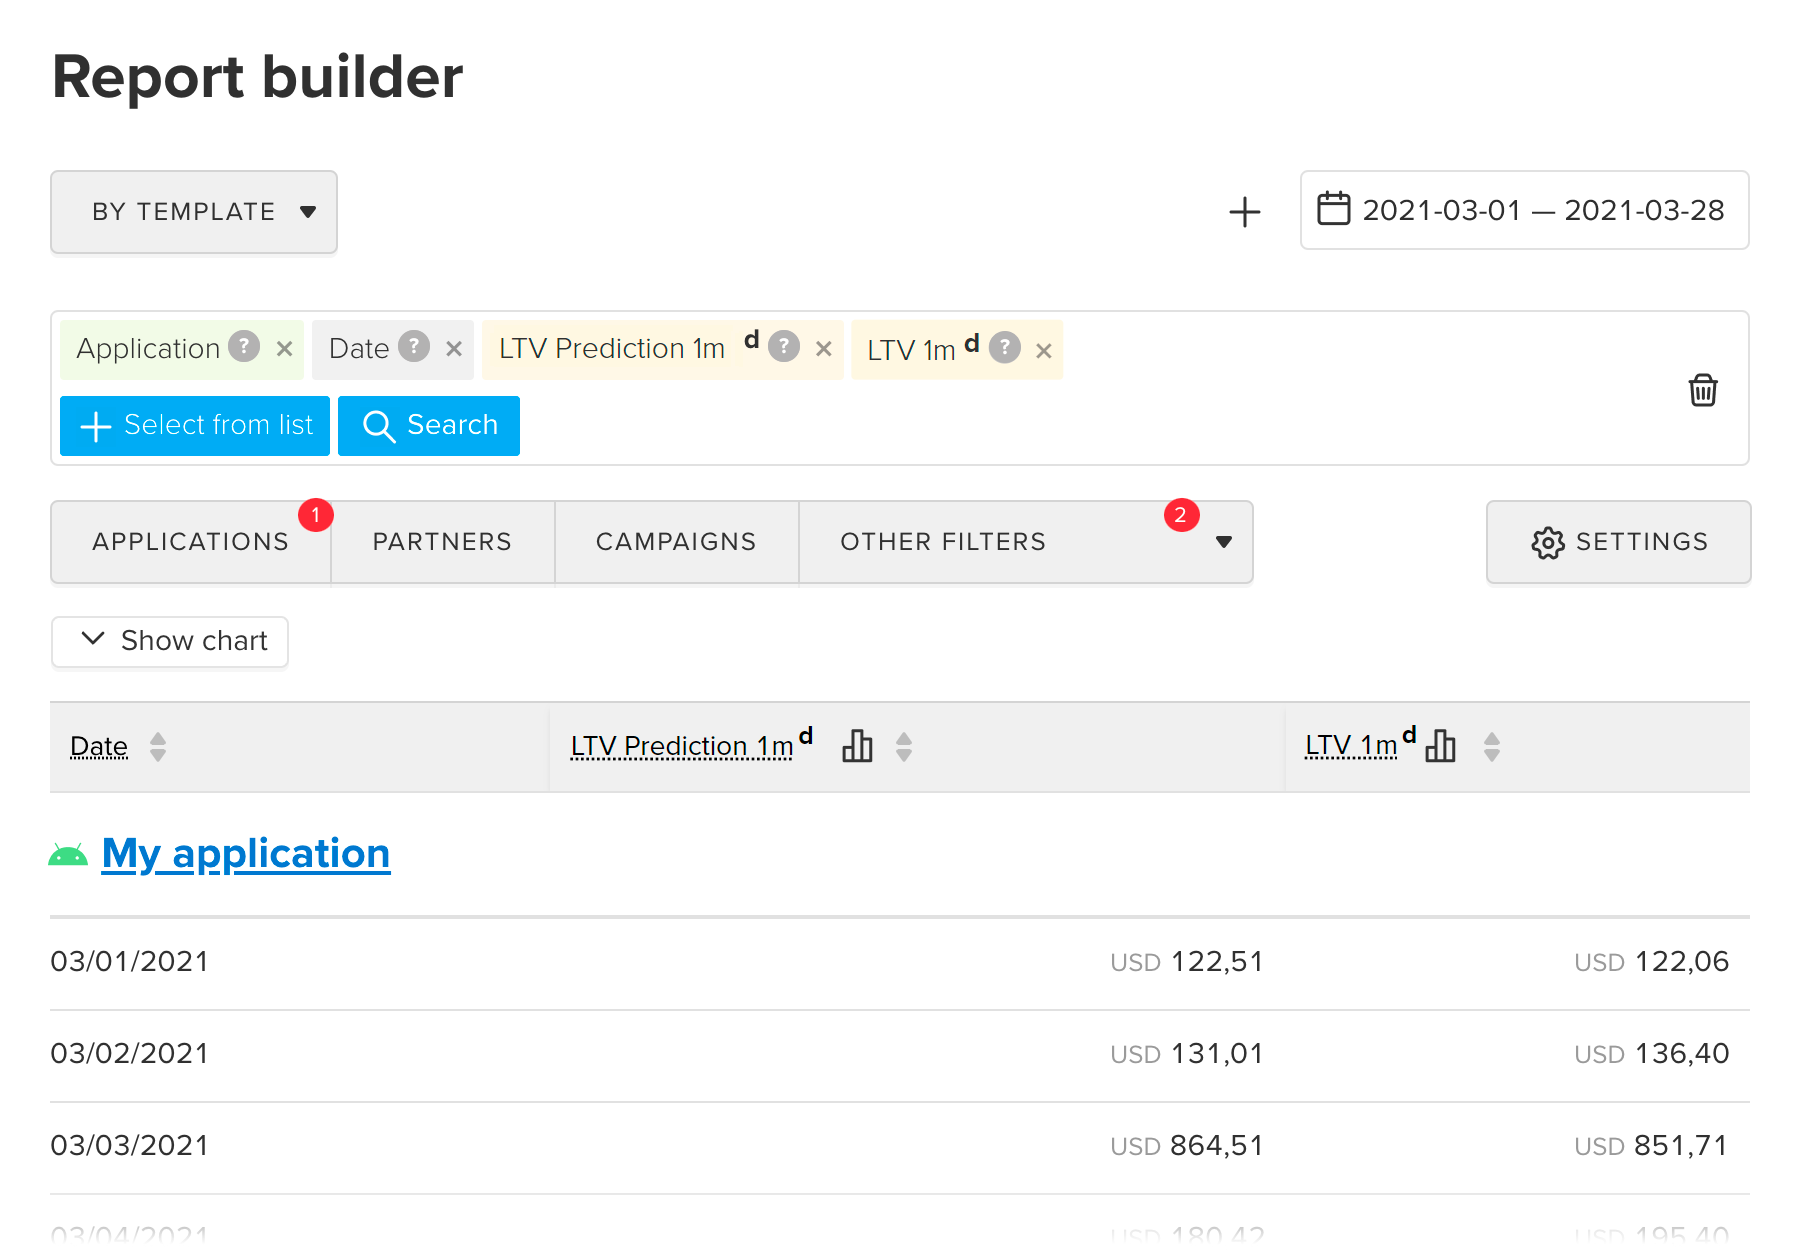
Add the dimension or filter Revenue type to assess an LTV forecast for purchases, subscriptions, in-app ads, and custom revenue.
LTV prediction models can operate with wrong data — game and app mechanics are often changed which influences user behavior and lead to prediction errors. But knowing the historical error, you can be more confident in prediction and can choose the forecast horizon for your current strategy.
Assess LTV Prediction in the Revenue type dimensions to calc the weighted average error for IAP LTV (revenue from purchases), Subscription LTV, and Ads LTV individually.
For LTV on purchases:
- Project+Date+Partner
- Project+Date+Country+Partner
- Project+Date
- Project+Month
- Project+Date+Campaign (further, divide small campaigns into cohorts:
build payment allocation on 8th day for the selected period and choose three groups: <50%, 50-75%, 75-100%)
For Ads LTV (revenue from in-app impressions):
- Project+Date
- Project+Month
- Project+Date+Ad network (admob, applovin, facebook, etc.)
- Project+Date+Country
- Project+Date+Campaign
For Subscription LTV:
- Project+Date
- Project+Month
- Project+Date+Country
- Project+Month+Country
- Project+Month+Traffic type
Example for the Project+Date cohort:
- LTV Prediction 1m Project1Data1 + ...+ Project1DataN
- LTV Prediction 2m Project1Data1 + ...+ Project1DataN
- LTV Prediction 3m Project1Data1 + ...+ Project1DataN
- LTV Prediction 6m Project1Data1 + ...+ Project1DataN
- LTV Prediction 1y Project1Data1 + ...+ Project1DataN
- LTV Prediction 2y Project1Data1 + ...+ Project1DataN
- LTV Prediction 1m Project2Data1 + ...+ Project2DataN
...
Example for the Project+Date cohort:
- LTV 1m Project1Data1 + ...+ Project1DataN
- LTV 2m Project1Data1 + ...+ Project1DataN
- LTV 3m Project1Data1 + ...+ Project1DataN
- LTV 6m Project1Data1 + ...+ Project1DataN
- LTV 1y Project1Data1 + ...+ Project1DataN
- LTV 2y Project1Data1 + ...+ Project1DataN
- LTV 1m Project2Data1 + ...+ Project2DataN
...
Example for the Project+Date cohort:
- Error for Project1 = |(LTV Prediction 1m+1$)/(LTV 1m+1$)–1|
- Error for Project2 = |(LTV Prediction 1m+1$)/(LTV 1m+1$)–1|
...
- Error for Project1 = |(LTV Prediction 2m+1$)/(LTV 2m+1$)–1|
- Error for Project2 = |(LTV Prediction 2m+1$)/(LTV 2m+1$)–1|
...
Example for the Project+Date cohort:
- The weighted average error = (Error_for_Project1*LTV_1m_for_Project1+ ... +Error_for_ProjectN*LTV_1m_for_ProjectN) / LTV_1m_for_Project1 + ... + LTV_1m_for_ProjectN
With the weighted average error, you can assess the prediction quality and decide to use it, and do not forgot model restrictions. If you have big errors, pass results and data on sales, and updates to our support team for some model adjusting.
Example of the weighted average error for IAP LTV Prediction
| IAP LTV 1m | IAP LTV 2m | IAP LTV 3m | IAP LTV 6m | IAP LTV 1y | IAP LTV 2y | |
|---|---|---|---|---|---|---|
| Project + Date + Partner | 11,5% | 14,1% | 15,8% | 20,7% | 40,1% | 45,8% |
| Project + Date + Campaign | 16,3% | 20,1% | 22,7% | 28,6% | 45,3% | 47,5% |
| Project + Date + Country + Partner | 26,2% | 32,9% | 36,9% | 43,7% | 50,7% | 58,2% |
| Project + Date | 10,4% | 12,6% | 14,2% | 18,7% | 33,4% | 41,1% |
| Project + Month | 5,7% | 8,4% | 10,2% | 14,3% | 22,5% | 26,2% |
Example of the weighted average error for Ads LTV Prediction
| Ads LTV 1m | Ads LTV 2m | Ads LTV 3m | Ads LTV 6m | Ads LTV 1y | Ads LTV 2y | |
|---|---|---|---|---|---|---|
| Project + Date | 11,8% | 17,1% | 18,8% | 22,4% | 30,3% | 37,4% |
| Project + Month | 08,8% | 16,4% | 17,3% | 20,5% | 33,6% | 38,1% |
| Project + Date + Ad network | 18,8% | 25,9% | 30,4% | 32,5% | 41,1% | 45,2% |
| Project + Date + Country | 16,0% | 24,7% | 29,6% | 33,4% | 39,5% | 46,6% |
| Project + Date + Campaign | 16,3% | 26,6% | 29,8% | 31,1% | 36,0% | 47,0% |
Example of the weighted average error for Subscription LTV Prediction
| Subscription LTV 1m | Subscription LTV 2m | Subscription LTV 3m | Subscription LTV 6m | Subscription LTV 1y | Subscription LTV 2y | |
|---|---|---|---|---|---|---|
| Project + Date | 13,1% | 18,4% | 20,2% | 26,3% | 33,5% | 41,6% |
| Project + Month | 6,2% | 9,7% | 11,8% | 16,5% | 20,1% | 26,3% |
| Project + Date + Country | 17,6% | 20,2% | 22,7% | 32,3% | 39,1% | 41,3% |
| Project + Month + Country | 15,7% | 19,0% | 21,6% | 27,6% | 33,5% | 39,6% |
| Project + Month + Traffic type | 11,2% | 13,6% | 17,7% | 22,6% | 29,7% | 34,6% |