/api/raw/v1/export/create.json?event=installs&selectors=idApp,idfa,advertisingId,tsEvent&dateTo=2022-02-28&dateFrom=2022-02-01&idSegment=1111&timezone=Europe/MoscowThe churn measures an app loss in payments, launches, and other audience activities for a given period. Users can stop using an app as early as the next day or a month after installation.
Predictions allow you to analyze audience engagement and prevent user drop-off. With forecast, you can:
MyTracker makes a forecast using machine learning models. Models analyze captured app data: installs, launches, payments, sessions, and can make a forecast one day after a user installed your app.
Churn rate prediction
Churn can be forecast for periods of 7, 14, 21, or 28 days after app installation. Predictive churn does not mean the app uninstall, it is a forecast about a device will not be active during a specified inactivity window ? following a selected forecast day.
For instance, your app was installed on 20 devices on 2021.01.01. Churn Prediction LT 7d = 50% would mean 10 devices will not be active for the period from 2021.01.08 till 2021.02.07 (during 30 days of inactivity window).
Churn probability prediction
In addition, MyTracker predicts the churn probability for the 7th day after installation for each device.
For instance, your app was installed on 20 devices on 2021.01.01. The forecast will show you which of these 20 devices will not be active after 08.01.2021 (during 30 days of inactivity window) with a probability greater than 80%.
If you have the churn prediction, you can take actions to retain users: relaunch ad campaigns, send push notifications, use deep links or personalize offers.
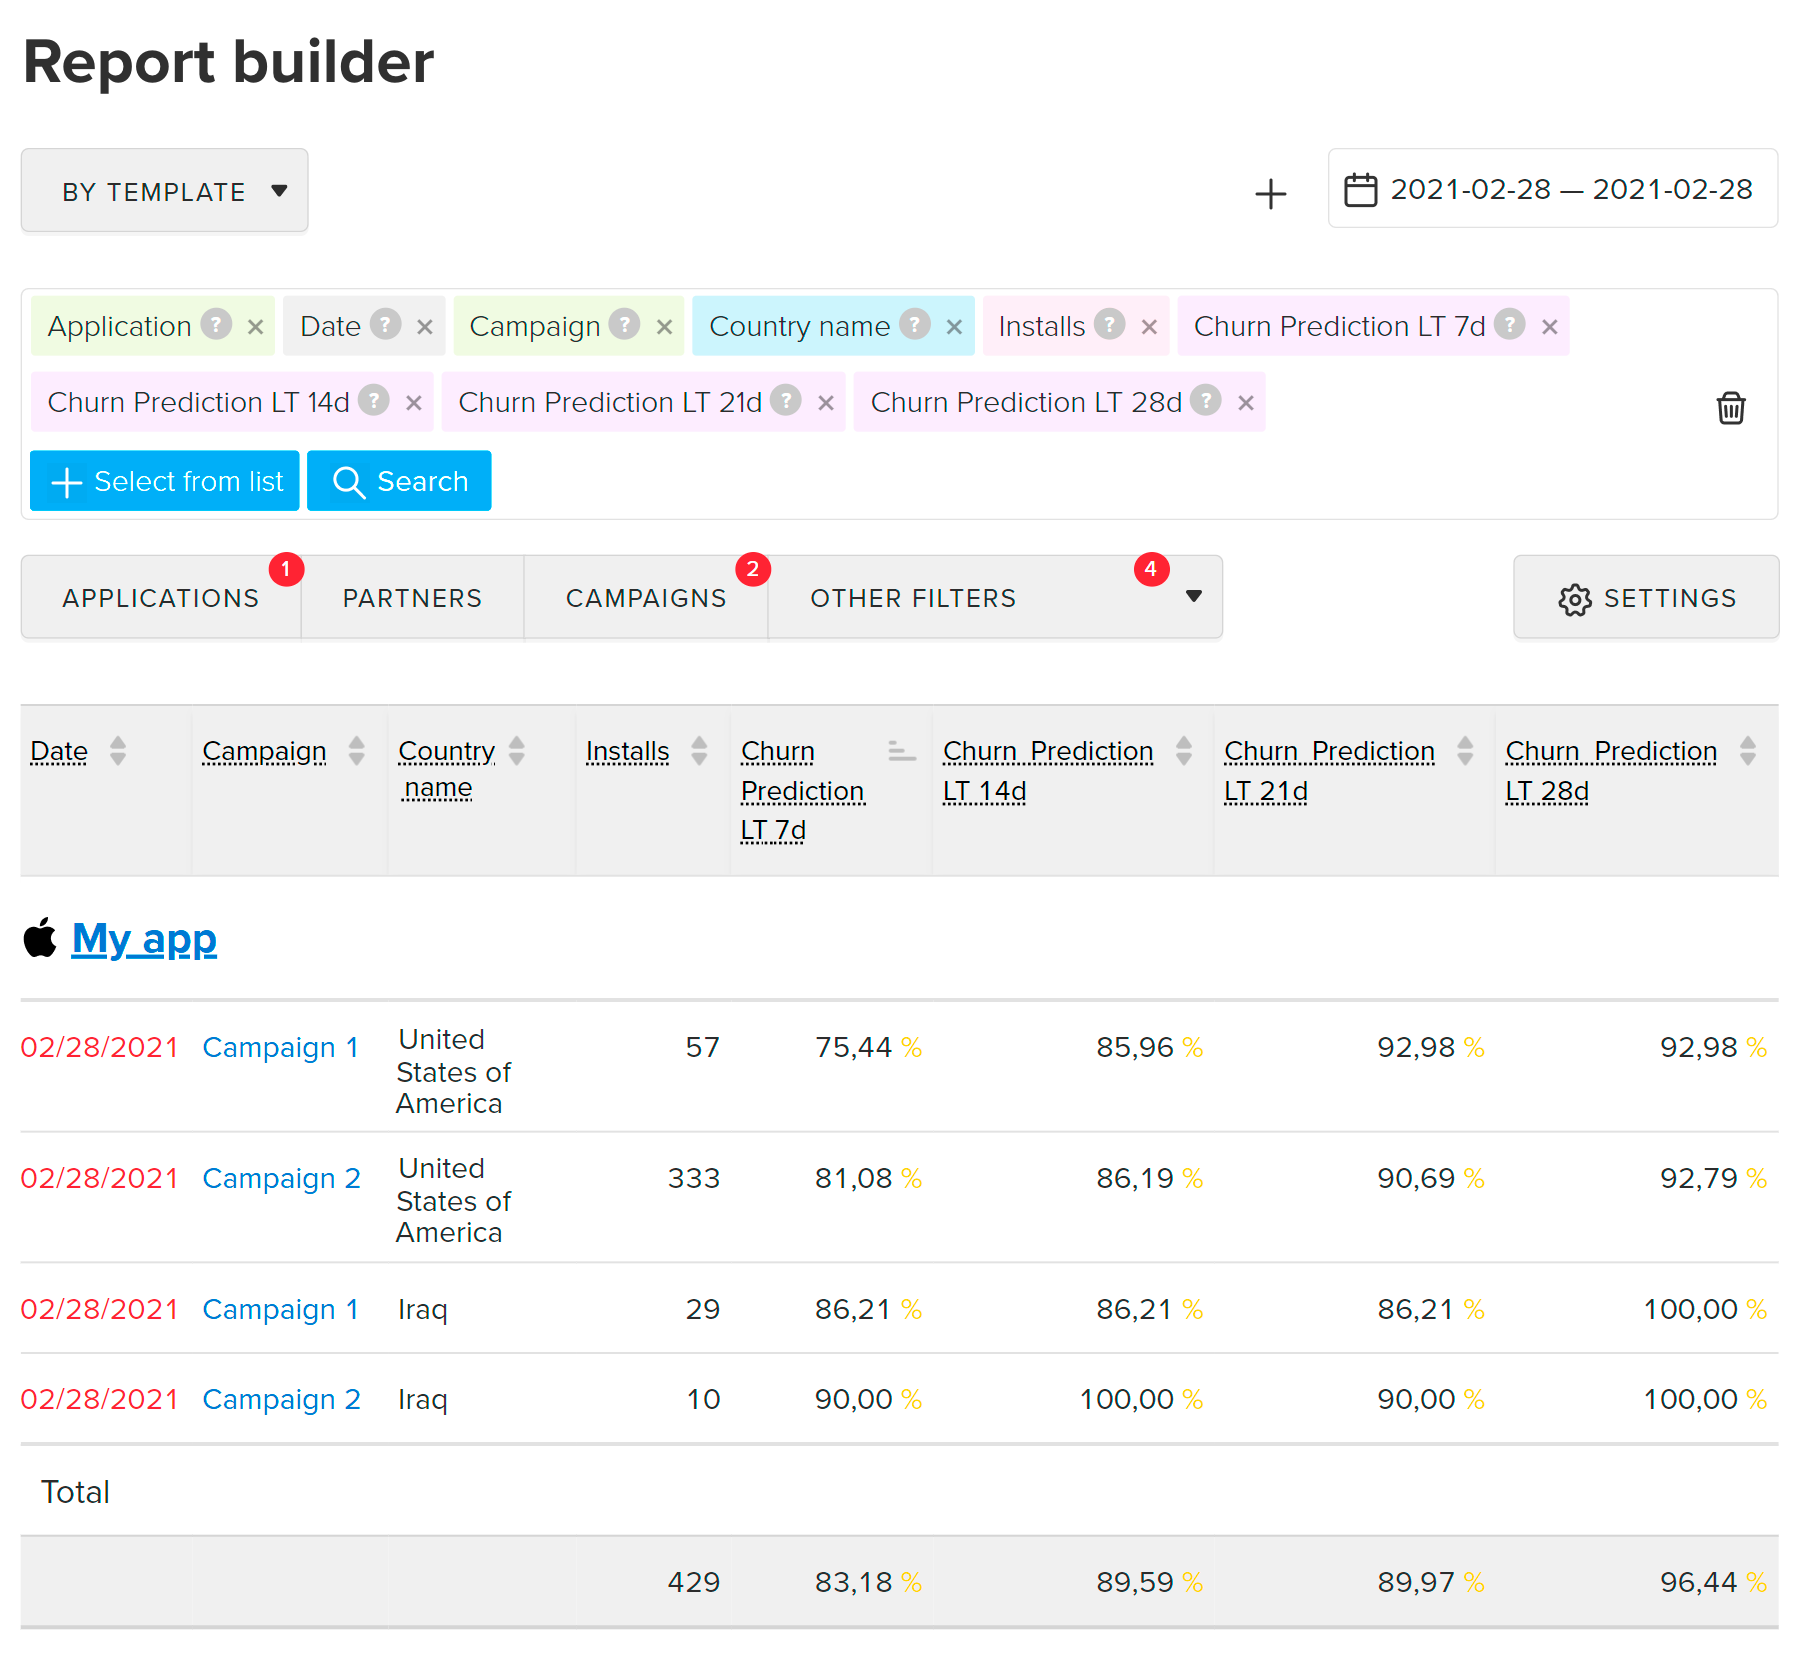
The churn prediction shows a percentage of devices that are probably going to stop using your app. Use this prediction to analyze potential losses for individual ad campaigns and countries:
Churn prediction LT metrics show the percentage of devices on which users installed your app during the reporting period that, according to the forecast, will be inactive after the specified period of time (7d, 14d, 21d, 28d) based on the inactivity window settings.

You can get reports with Churn forecast using Export API
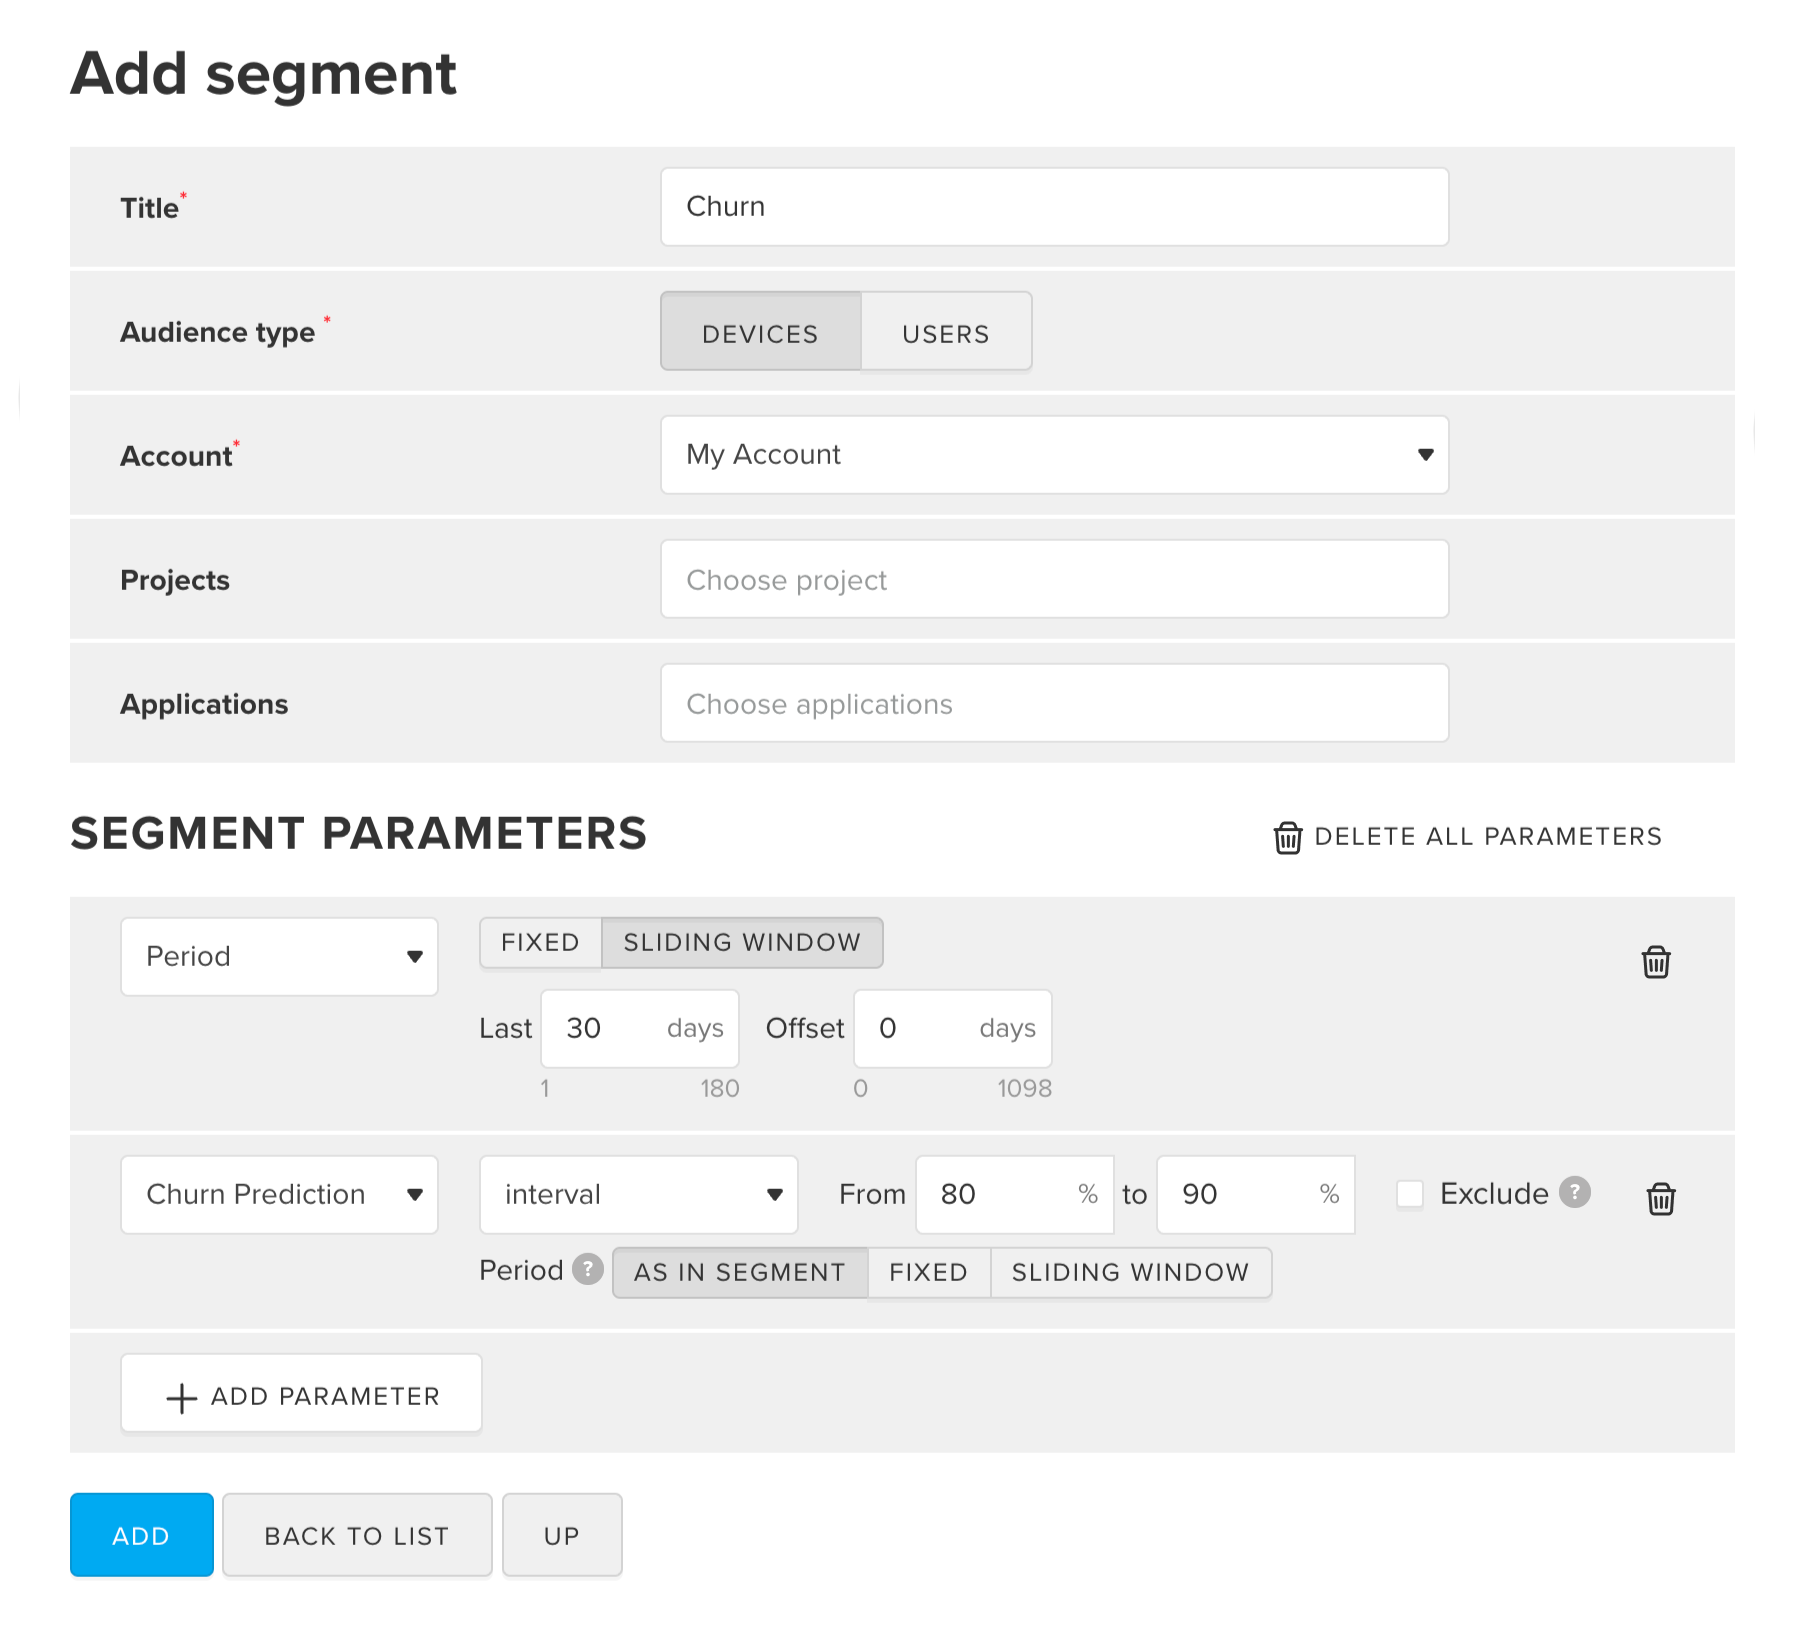
Churn probability prediction allows you to get a list of devices, which will stop using the app with a probability of 80 – 100%. By using this list, you can run targeted campaign and reduce churn.
To download device identifiers with a high churn probability:

For details, refer to the Add segment section
You can export the data using the MyTracker interface if you only need to get the IDs of the devices without additional data about installation time, campaign, etc. For details, refer to the Export segment section.
installs:
idSegment created
in the first step. You can find it on the segment page
in the address bar of your browser.
idfa,
advertisingId (gaid),
time of installation tsEvent.
See the complete list of selectors in the
Selectors dictionary.
/api/raw/v1/export/create.json?event=installs&selectors=idApp,idfa,advertisingId,tsEvent&dateTo=2022-02-28&dateFrom=2022-02-01&idSegment=1111&timezone=Europe/MoscowFor details, refer to the Export segment section
You will get a CSV file with list of device identifiers with the specified churn probability.